Instrument Figures
Overview
In complex simulations, there are usually several statistics that are vital for understanding what is happening inside the network. Although statistics can also be found and read in Qtenv’s object inspector panel, it is often more convenient to display them directly on the top-level canvas in a graphical form. INET supports such visualization in the form of inspector figures that display various gauges and meters. This chapter covers the usage of instrument figures.
Instrument Types
Some of the instrument figure types available in INET are as follows:
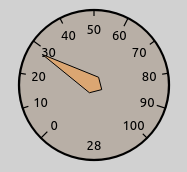
gauge: A circular gauge similar to a speedometer or pressure indicator.
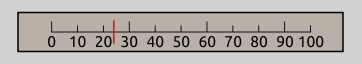
linearGauge: A horizontal linear gauge similar to a VU meter.
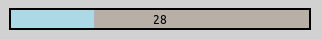
progressMeter: A horizontal progress bar.
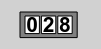
counter: An integer counter.
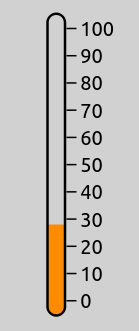
thermometer: A vertical meter visually similar to a real-life thermometer.
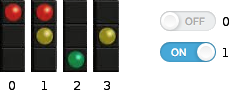
indexedImage: A figure that displays one of several images: the first image for the value 0, the second image for the value of 1, and so on.
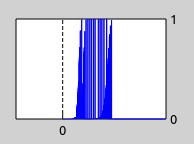
plot: An XY chart that plots a statistic as a function of time.
Using Instrument Figures
Instrument figures visualize statistics derived from signals emitted by
modules in the network. This statistic is declared in the NED file, with
the @statistic property. The property’s source attribute is an
expression that specifies which signals to use from which modules, and
the mathematical operations on them, to derive the statistic. The
record attribute specifies where the values of the statistic are
recorded. In the case of instrument figures, this is set to
figure, i.e., record=figure. The targetFigure attribute
selects which figure should display the statistic.
The instrument figure itself is specified in the NED file with the
@figure property. The property’s type attribute selects
the type of instrument figure (gauge, thermometer, etc.),
and the property’s index (i.e., the figure name) should match the
name given in the statistic’s targetFigure attribute.
Here is an example NED file:
@statistic[numRcvdPk](source=count(client.app[0].rcvdPk); record=figure; targetFigure=counter);
@figure[numRcvdPkCounter](type=counter; pos=413,327; label="Packets received"; decimalPlaces=4);
This creates a figure named numRcvdPkCounter, which displays a counter.
The statistic numRcvdPk counts the packets received by the client host’s
first application, and records it in the numRcvdPkCounter figure.
Instrument Figure Attributes
Instrument figures have various attributes that customize their
position, size, appearance, label text and font, minimum and maximum
values, and so on. The following list shows the attributes recognized
by the various figure types (a similar list can be produced by running
INET with the -h figures command-line option):
counter:type,visible,zIndex,tooltip,tags,transform,backgroundColor,decimalPlaces,digitBackgroundColor,digitBorderColor,digitFont,digitColor,label,labelFont,labelColor,initialValue,pos,anchor,labelOffsetgauge:type,visible,zIndex,tooltip,tags,transform,backgroundColor,needleColor,label,labelFont,labelColor,minValue,maxValue,tickSize,colorStrip,initialValue,pos,size,anchor,bounds,labelOffsetindexedImage:type,visible,zIndex,tooltip,tags,transform,images,tintAmount,tintColor,opacity,interpolation,label,labelFont,labelColor,labelOffset,initialValue,pos,size,anchor,boundsindicatorLabel:type,visible,zIndex,tooltip,tags,transform,pos,anchor,text,font,color,opacity,halo,textFormat,initialValueindicatorText:type,visible,zIndex,tooltip,tags,transform,pos,anchor,text,font,color,opacity,halo,textFormat,initialValuelinearGauge:type,visible,zIndex,tooltip,tags,transform,backgroundColor,needleColor,label,labelFont,labelColor,minValue,maxValue,tickSize,cornerRadius,initialValue,pos,size,anchor,bounds,labelOffsetplot:type,visible,zIndex,tooltip,tags,transform,valueTickSize,timeWindow,timeTickSize,lineColor,minValue,maxValue,backgroundColor,label,labelOffset,labelColor,labelFont,numberSizeFactor,pos,size,anchor,boundsprogressMeter:type,visible,zIndex,tooltip,tags,transform,backgroundColor,stripColor,cornerRadius,borderWidth,minValue,maxValue,text,textFont,textColor,label,labelOffset,labelFont,labelColor,initialValue,pos,size,anchor,boundsthermometer:type,visible,zIndex,tooltip,tags,transform,mercuryColor,label,labelFont,labelColor,minValue,maxValue,tickSize,initialValue,pos,size,anchor,bounds,labelOffset