Visualizing IPv4 Routing Tables
Goals
Determining the routes that IPv4 packets take in a multi-hop network can be a tedious task. The routing information is stored in the IPv4 routing tables of the network nodes, which are scattered throughout the network, making it difficult to get a comprehensive view. INET offers a visualizer that can graphically display the routing information, making it easier to understand the routing in a simulation without having to inspect individual routing tables.
This showcase includes three simulation models of increasing complexity, demonstrating the different features of routing table visualization.
3.6About the visualizer
In INET, the RoutingTableVisualizer module (included in the network as part of IntegratedCanvasVisualizer) is responsible for visualizing routing table entries.
The visualizer basically annotates network links with labeled arrows that connect source nodes to next hop nodes. The module visualizes those routing table entries that participate in the routing of a given set of destination addresses, by default the addresses of all interfaces of all nodes in the network. That is, it selects the best (longest prefix) matching routes for all destination addresses from each routing table, and shows them as arrows that point to the next hop. Note that one arrow might need to represent several routing entries, for example when distinct prefixes are routed towards the same next hop.
Routing table entries are represented visually by solid arrows. An arrow
going from a source node represents a routing table entry in the source
node’s routing table. The endpoint node of the arrow is the next hop in
the visualized routing table entry. By default, the routing entry is
displayed on the arrows in the following format: destination/mask -> gateway (interface)
The format can be changed by setting the visualizer’s labelFormat
parameter.
Filtering is also possible. The nodeFilter parameter controls which
nodes’ routing tables should be visualized (by default, all nodes), and
the destinationFilter parameter selects the set of destination nodes
to consider (again, by default all nodes).
The visualizer reacts to changes. For example, when a routing protocol changes a routing entry, or an IP address gets assigned to an interface by DHCP, the visualizer automatically updates the visualizations according to the specified filters. This feature is very useful, e.g. for the simulation of mobile ad-hoc networks.
Displaying all routing tables
The following example demonstrates how to enable the visualization of
routing tables, and how the visualization looks like. The simulation can
be run by choosing the DisplayingAll configuration from the ini
file. The network for the simulation contains two StandardHost’s,
each connected to a Router. IP addresses are assigned by the
Ipv4NetworkConfigurator module, which also fills in the routing tables
automatically. The visualizer module is an IntegratedCanvasVisualizer
which contains all available visualizers as submodules.
The configuration contains one line, which enables the visualization of
routing tables with the displayRoutingTables parameter:
*.visualizer.displayRoutingTables = true
All other parameters of the visualizer are left on default.
When the simulation is run, the network looks like this:
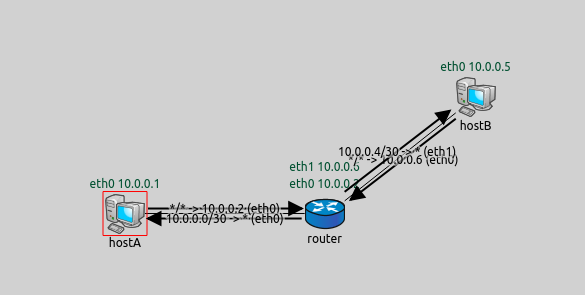
Note that IP addresses are displayed above the nodes. These annotations have nothing to do with the RoutingTableVisualizer; they are displayed because we configured it in InterfaceTableVisualizer to improve clarity.
Here are the routing tables of the two hosts and the router, with the visualized entries highlighted:
Node RoutingTableVisualizationDisplayingAllShowcase.hostA
-- Routing table --
Destination      Netmask          Gateway          Iface           Metric
10.0.0.0         255.255.255.252  *                eth0 (10.0.0.1) 0
*                *                10.0.0.2         eth0 (10.0.0.1) 0

Node RoutingTableVisualizationDisplayingAllShowcase.hostB
-- Routing table --
Destination      Netmask          Gateway          Iface           Metric
10.0.0.4         255.255.255.252  *                eth0 (10.0.0.5) 0
*                *                10.0.0.6         eth0 (10.0.0.5) 0

Node RoutingTableVisualizationDisplayingAllShowcase.router
-- Routing table --
Destination      Netmask          Gateway          Iface           Metric
10.0.0.0         255.255.255.252  *                eth0 (10.0.0.2) 0
10.0.0.4         255.255.255.252  *                eth1 (10.0.0.6) 0
The destination, netmask, gateway, and the interface from the highlighted entries are indicated on the arrows.
Note that in the OMNeT++ Qtenv GUI you can click on an arrow, and the corresponding routing table entry will be shown in the inspector window.
Filtering routing table entries
By default, the best matching routing table entries from all routing
tables towards all destinations are visualized. This visualization can leave the
network cluttered with arrows. It is possible to narrow the selection of
visualized routing tables with filter parameters. The goal of this
section is to demonstrate the use of the nodeFilter and
destinationFilter parameters.
The section contains two example simulations, which use a more complex network compared to the simulation in the previous section. The simulations demonstrate the visualization when it is unfiltered and when it is filtered. The network looks like the following:
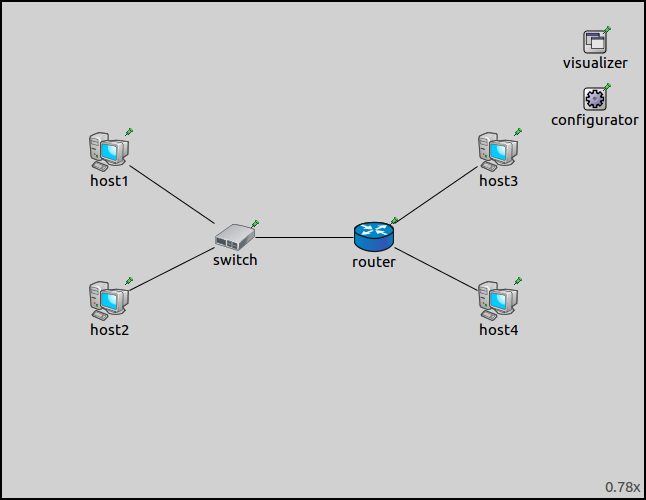
It consists of a router connected to a switch. Two StandardHost’s are connected to the switch, and two additional StandardHost’s are connected to the router.
Unfiltered routing table visualization
The example simulation can be run by choosing the Unfiltered
configuration from the ini file. The defaults of the nodeFilter and
destinationFilter parameters are "*", which means the best
matching routing entries towards all destinations from all routing
tables are visualized. With the default settings, the network looks like
the following:
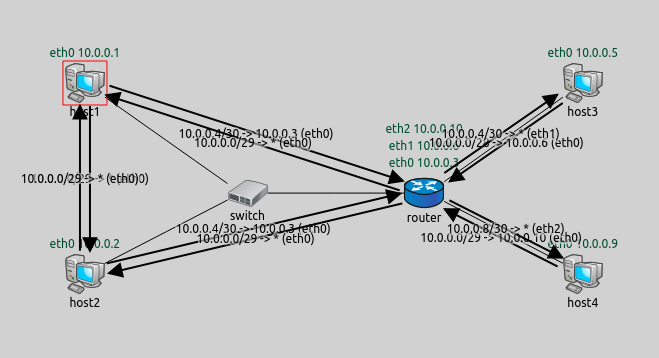
You might have noticed that the arrows don’t go through the switch. That is because L2 devices, such as switches and access points, don’t have IP addresses or routing tables. They are effectively transparent for the route visualization algorithm. The visualizer could, in theory, know that the packets will take a path that goes through the switch. However, in the general case, there may be multiple interconnected switches and multiple paths that the packets can take, making the visualization a complicated issue.
Filtered routing table visualization
The example simulation can be run by choosing the Filtered
configuration from the ini file. This example simulation only visualizes
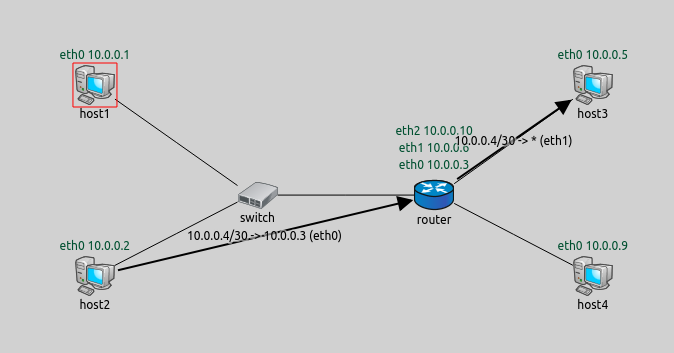
the routes going from host2 to host3. First, the
destinationFilter parameter is set to host3. To narrow down the
visualized routes to the ones that lead from host2, the
nodeFilter parameter is specified as "host2 or host3 or router".
(One could also write "not(host1 or host4)" for the same effect.)
Note that router needs to be included because the route from
host2 to host3 leads through it.
The visualized routing entries look like the following:
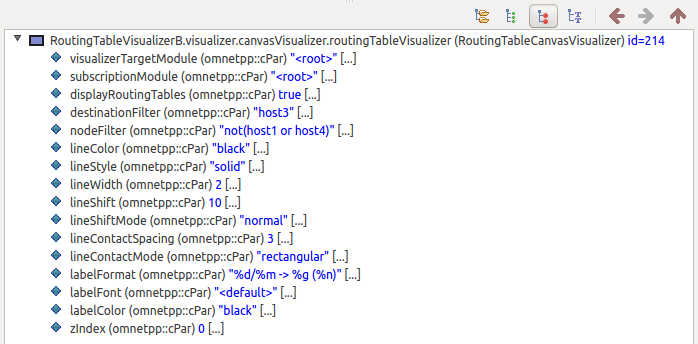
The visualizer’s parameters can be changed in the runtime environment, and the changes take effect immediately. Just select the RoutingTableVisualizer module, and the parameters are listed in the inspector panel:
Visualizing changing routing tables
The examples so far have had static routes, but in many scenarios,
routing tables change dynamically. In the following example simulation,
the routing tables are changed by AODV (Advanced On-Demand Vector
Routing Protocol). The simulation can be run by choosing the Dynamic
configuration from the ini file.
The network contains a series of AodvRouter’s. These are mobile hosts
that have AODV and IP forwarding enabled. Six of the hosts are laid out
in a chain and are stationary. Their communication ranges are specified
so that each host can only reach the adjacent hosts. destinationHost
moves up and down along the chain and is only in the communication
range of one or two nearby hosts.
We want the AODV protocol to configure the routing tables, so the
network configurator is instructed not to add static routes.
sourceHost is configured to ping destinationHost. Since each
host is capable of reaching the adjacent hosts only, the ping packets
are relayed to destinationHost through the chain. As the network
topology changes because of node mobility, the AODV protocol dynamically
configures the routing tables. To reduce clutter, we set the
destinationFilter parameter of the visualizer to
"destinationHost".
The following animation depicts what happens when the simulation is run.
When destinationHost starts to move downwards, packets get routed
along the chain to the host that is currently adjacent to
destinationHost. Finally, this host relays the packets to
destinationHost. As the node moves, routing tables are kept up to
date by AODV to relay the packets along the chain to
destinationHost. On the way back, the lower hosts are not taking
part of the packet relay, and the unused entries remain in their routing
tables for a while, then they time out and are removed. When
destinationHost gets to the top of the scene, the process
starts over again. The visualizer continually reacts to changes in the
routing tables and updates the visualization accordingly.
More information
This example only demonstrated the key features of routing table visualization. For more information, refer to the RoutingTableVisualizer NED documentation.
Try It Yourself
If you already have INET and OMNeT++ installed, start the IDE by typing
omnetpp, import the INET project into the IDE, then navigate to the
inet/showcases/visualizer/canvas/routingtable folder in the Project Explorer. There, you can view
and edit the showcase files, run simulations, and analyze results.
Otherwise, there is an easy way to install INET and OMNeT++ using opp_env, and run the simulation interactively.
Ensure that opp_env is installed on your system, then execute:
$ opp_env run inet-4.6 --init -w inet-workspace --install --build-modes=release --chdir \
   -c 'cd inet-4.6.*/showcases/visualizer/canvas/routingtable && inet'
This command creates an inet-workspace directory, installs the appropriate
versions of INET and OMNeT++ within it, and launches the inet command in the
showcase directory for interactive simulation.
Alternatively, for a more hands-on experience, you can first set up the workspace and then open an interactive shell:
$ opp_env install --init -w inet-workspace --build-modes=release inet-4.6
$ cd inet-workspace
$ opp_env shell
Inside the shell, start the IDE by typing omnetpp, import the INET project,
then start exploring.
Discussion
Use this page in the GitHub issue tracker for commenting on this showcase.