Visualizing Submodule Information
Goals
In INET, network nodes are typically composed of multiple submodules, such as apps, protocols, and protocol parts. These submodules often contain important information for understanding the behavior of the network, but accessing it can be difficult, as it requires drilling down into the graphical inspector or object inspector.
To make this information more accessible, INET provides a feature for displaying submodule information on the top-level canvas, near the corresponding network node icons. This makes the information readily available at a glance.
This showcase features a simple WiFi network model and demonstrates how to display (1) the number of packets sent and received by an application, and (2) the IEEE 802.11 MAC state information, on the network level.
4.6About the visualizer
The InfoVisualizer module (included in the network as part of IntegratedCanvasVisualizer) can visualize information provided by submodules one or more levels down in the module hierarchy. This information is visualized at the submodule of the containing network node, typically at the top level canvas. The following image illustrates this with the example of an application that communicates over UDP:
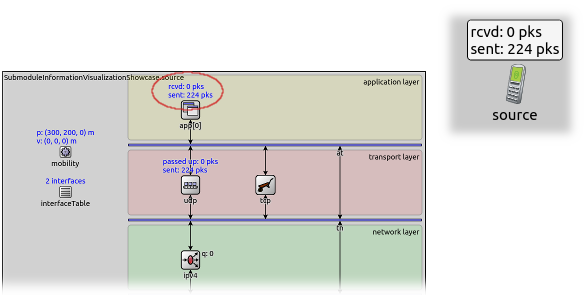
The image on the left shows the inside of a host. The text displayed above
the app[0] submodule indicates the number of packets sent/received by
that application, which can be quite a useful piece of information.
However, to see it, the user has to go into the host, which is especially
inconvenient if there are several such hosts to watch. The image on
the right shows how, with the help of InfoVisualizer, the same
information can be displayed over the host’s icon on the top level canvas.
The submodules whose states should be visualized can be selected with
the visualizer’s modules parameter. This parameter takes full path
module names. Wildcards can be used to select a certain submodule in
multiple nodes. Additionally, one can specify multiple submodules for a
node. By default, the value of the modules parameter is "" (no
information displayed.) Also, the visualization can be turned on and off
with the displayInfos parameter, which is true by default.
The visualizer can display module information in various ways, selected
with the format parameter. This model takes a format string, which can
contain the following directives:
%n: module full name%p: module full path%t: display string text, i.e. thettag of the submodule’s display string%s: the return value of the module’sstr()function
The default format string is "%s".
On the example image above, the display string text is visualized,
selected with the "%t" directive.
Example Simulations
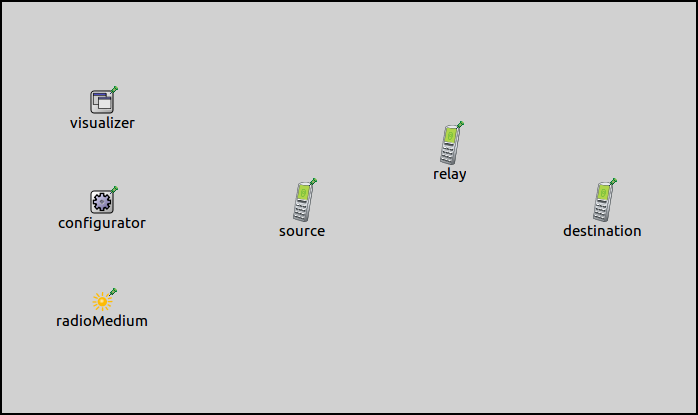
In the example simulation, three wireless nodes will communicate via
wifi. The network contains three AdhocHost’s arranged in a chain.
The communication ranges of hosts are determined by their radio
transmitter power, which is configured so that hosts can only reach
adjacent hosts in the chain. Hosts’ routing tables are set up
accordingly, thus packets going between source and destination
are routed via relay.
The network also contains an Ipv4NetworkConfigurator, an
Ieee80211ScalarRadioMedium, and an IntegratedCanvasVisualizer module.
Displaying Packet Counts
In this example, we use the visualizer to display the number of packets sent and
received by the UDP application. Thus, for the modules parameter,
we specify the app[0] submodules of the hosts. The format parameter
is set to display the submodule’s display string text.
*.visualizer.infoVisualizer.modules = "*.*.app[0]"
*.visualizer.infoVisualizer.format = "%t"
*.visualizer.infoVisualizer.placementHint = "topCenter"
To run the simulation, choose the PacketCounts configuration
from the ini file.
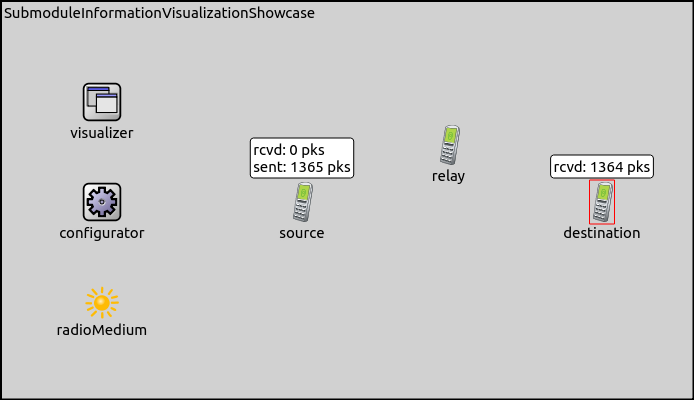
The counts are updated as the simulation progresses.
Displaying MAC State
In this example, we’ll visualize the state of the wifi MAC modules: reception state, transmission state, and contention state.
The IEEE 802.11 MAC is the wlan[0].mac submodule inside each host.
It is a compound module itself. The transmission process is in its
tx submodule, reception is in its rx submodule, and
the submodule responsible for contention in DCF mode is the
dcf.channelAccess.contention submodule. All three submodules
display their internal states via display string t tags
so we can use the InfoVisualizer to display them over
the host icons.
The visualizer allows specifying multiple submodules in the modules
parameter so that we can list all of tx, rx, and contention:
*.visualizer.infoVisualizer.modules = "*.*.wlan[0].mac.tx OR *.*.wlan[0].mac.rx OR *.*.wlan[0].mac.dcf.channelAccess.contention "
*.visualizer.infoVisualizer.format = "%n: %t"
The simulation can be run by choosing the MACStates configuration
from the ini file. The following captured video shows the result:
In the video, you can follow how the MAC states of nodes change as frames are
transmitted and received. For example, when source starts transmitting
a data frame, its tx state switches to TRANSMIT, and when the beginning
of the frame reaches relay, relay’s rx state changes to BUSY.
Sources: omnetpp.ini, SubmoduleInformationVisualizationShowcase.ned
Try It Yourself
If you already have INET and OMNeT++ installed, start the IDE by typing
omnetpp, import the INET project into the IDE, then navigate to the
inet/showcases/visualizer/canvas/submoduleinfo folder in the Project Explorer. There, you can view
and edit the showcase files, run simulations, and analyze results.
Otherwise, there is an easy way to install INET and OMNeT++ using opp_env, and run the simulation interactively.
Ensure that opp_env is installed on your system, then execute:
$ opp_env run inet-4.6 --init -w inet-workspace --install --build-modes=release --chdir \
   -c 'cd inet-4.6.*/showcases/visualizer/canvas/submoduleinfo && inet'
This command creates an inet-workspace directory, installs the appropriate
versions of INET and OMNeT++ within it, and launches the inet command in the
showcase directory for interactive simulation.
Alternatively, for a more hands-on experience, you can first set up the workspace and then open an interactive shell:
$ opp_env install --init -w inet-workspace --build-modes=release inet-4.6
$ cd inet-workspace
$ opp_env shell
Inside the shell, start the IDE by typing omnetpp, import the INET project,
then start exploring.
Discussion
Use this page in the GitHub issue tracker for commenting on this showcase.