Visualizing Terrain and Urban Environment
Goals
This showcase demonstrates adding a map in the simulation. Displaying a map in a network simulation provides a real-world context and can help improve the visual appeal of the simulation. It also helps place network nodes in a geographic context and allows the addition of objects, such as buildings. The map doesn’t have any effect on the simulation; it only alters the visuals of the network.
It contains three example configurations of increasing complexity, each demonstrating various features of the visualization.
Note
This showcase requires OMNeT++ built with OSG and osgEarth enabled. Currently, this is only possible on Windows.
4.6About the Visualizer
The map can be displayed by including a SceneOsgEarthVisualizer module in the network. It can display the map in the 3D view by using osgEarth, thus any part of the world can be inserted (provided there is a source for the map data). The use of the map requires an Internet connection, and it is only available in the 3D view.
Visualization with the Default Settings
This example configuration demonstrates inserting the map of downtown
Boston into the simulation. It can be run by choosing the
DefaultSettings configuration from the ini file. It uses the
following network:
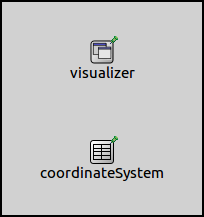
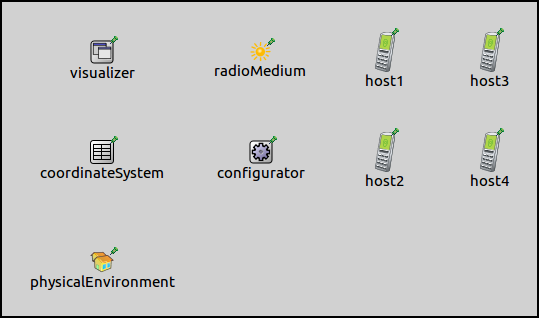
The network contains an IntegratedCanvasVisualizer and an
OsgGeographicCoordinateSystem module. The configuration from
omnetpp.ini is the following:
*.visualizer.osgVisualizer.sceneVisualizer.typename = "SceneOsgEarthVisualizer"
*.visualizer.osgVisualizer.sceneVisualizer.mapFile = "boston.earth"

# Coordinates of the scene origin on the map
*.coordinateSystem.sceneLongitude = -71.06792deg
*.coordinateSystem.sceneLatitude = 42.35717deg
By default, the type of the scene visualizer module in IntegratedCanvasVisualizer is SceneOsgVisualizer. Inserting the map requires the SceneOsgEarthVisualizer module, thus, the default OSG scene visualizer is replaced. The SceneOsgEarthVisualizer provides the same functionality as SceneOsgVisualizer and adds support for the osgEarth map.
To display the map, the visualizer requires a .earth file. This is an
XML file that specifies how the source data is turned into a map and
how to fetch the necessary data from the Internet. In this
configuration, we use the boston.earth file that contains
OpenStreetMap configured
as map data source. More .earth files can be found at
osgearth.org and there are also instructions
there on how to create .earth files.
Locations on the map are identified with geographical coordinates, i.e.,
longitude and latitude. In INET, locations of nodes and objects are
represented internally by Cartesian coordinates relative
to the simulation scene’s origin, and the
OsgGeographicCoordinateSystem module is responsible for
converting between geographical and Cartesian coordinates.
To define the mapping between the two, the geographical
coordinates of the simulation scene’s origin must be specified in
the coordinate system module’s sceneLongitude and sceneLatitude
parameters. In our configuration, the scene’s origin is set to somewhere
near a large park in Boston. Additionally, the origin’s altitude
could also be configured (sceneAltitude); however, specifying
the latitude and longitude is sufficient for the map visualization to work.
The scene’s orientation can also be specified in the coordinate system module’s
parameters using Euler angles (sceneHeading,
sceneElevation, sceneBank). In the default setting,
the X-axis points East, the Y-axis points North, and the Z-axis
points up.
The size of the simulation scene is determined automatically, taking into account the position of objects, network nodes, and movement constraints of network nodes. Thus, everything in the simulation should happen within the boundaries of the simulation scene. The scene floor is visualized on the map using a semi-transparent rectangle overlay. (Displaying the scene floor is optional but turned on by default.) When the simulation starts, the view will be centered on the Cartesian coordinate system’s origin if there are no nodes in the network. If there are nodes, the initial viewpoint will be set so that all nodes are visible.
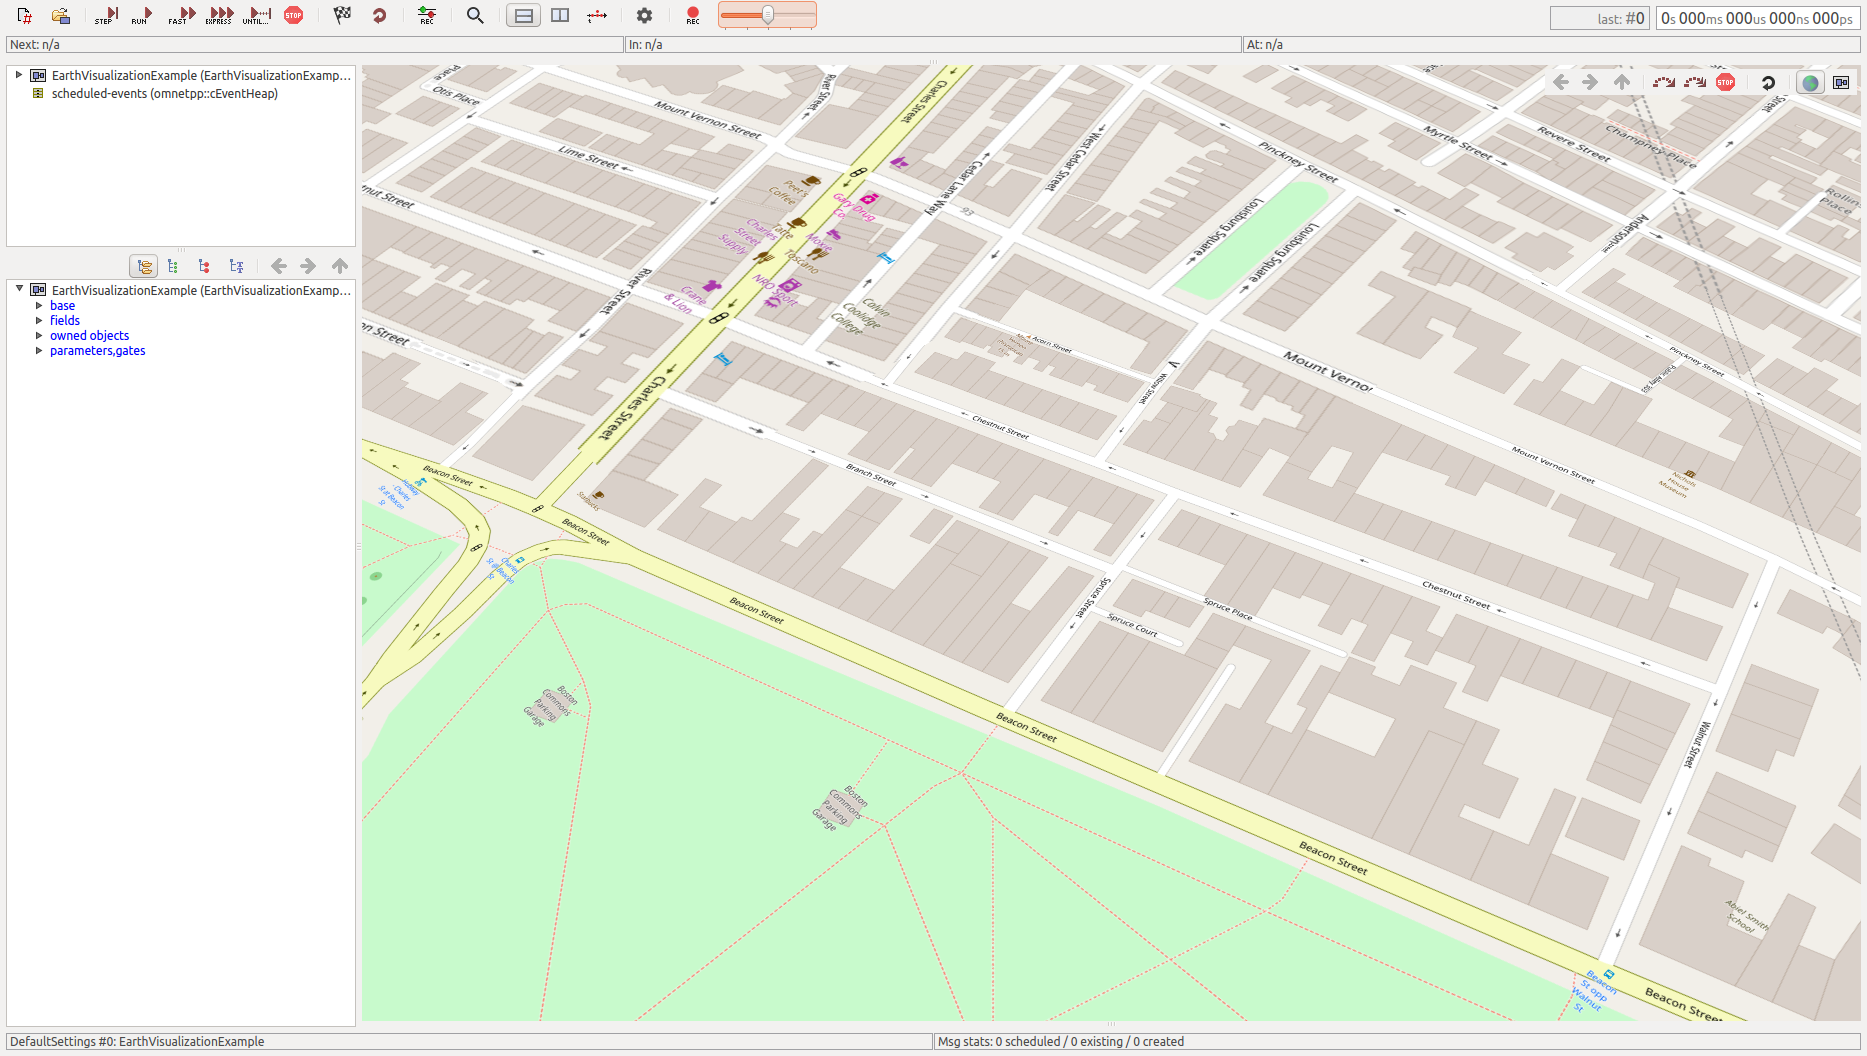
The scene’s 3D view should look like the following when the simulation is run. The map is displayed on the 3D scene. Since there are no nodes or objects in the network, the size of the scene is zero and the screen floor is not visible.
Adding Physical Objects
The map doesn’t affect simulations in any way; it just gives a real-world
context to them. For network nodes to interact with their environment,
physical objects have to be added. The example configuration for this
section can be run by selecting the PhysicalObjects configuration
from the ini file. It extends the previous configuration by adding
physical objects, meant to represent blocks of buildings, to the simulation.
The objects could affect radio transmissions if an obstacle loss model were set.
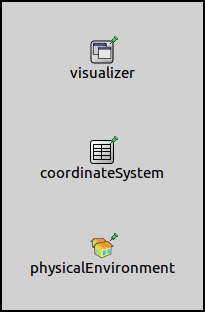
The network for this configuration extends the network from the previous section with a PhysicalEnvironment module:
The configuration for this example simulation extends the previous configuration with the following:
*.physicalEnvironment.coordinateSystemModule = "coordinateSystem"
*.physicalEnvironment.config = xmldoc("obstacle.xml")
The PhysicalEnvironment module is responsible for placing the
physical objects on the scene. The physical environment module
doesn’t use a coordinate system module by default, but it is configured to use
the one present in the network. This module makes it possible to define the
objects using geographical coordinates. The objects are defined in the
obstacle.xml config file.
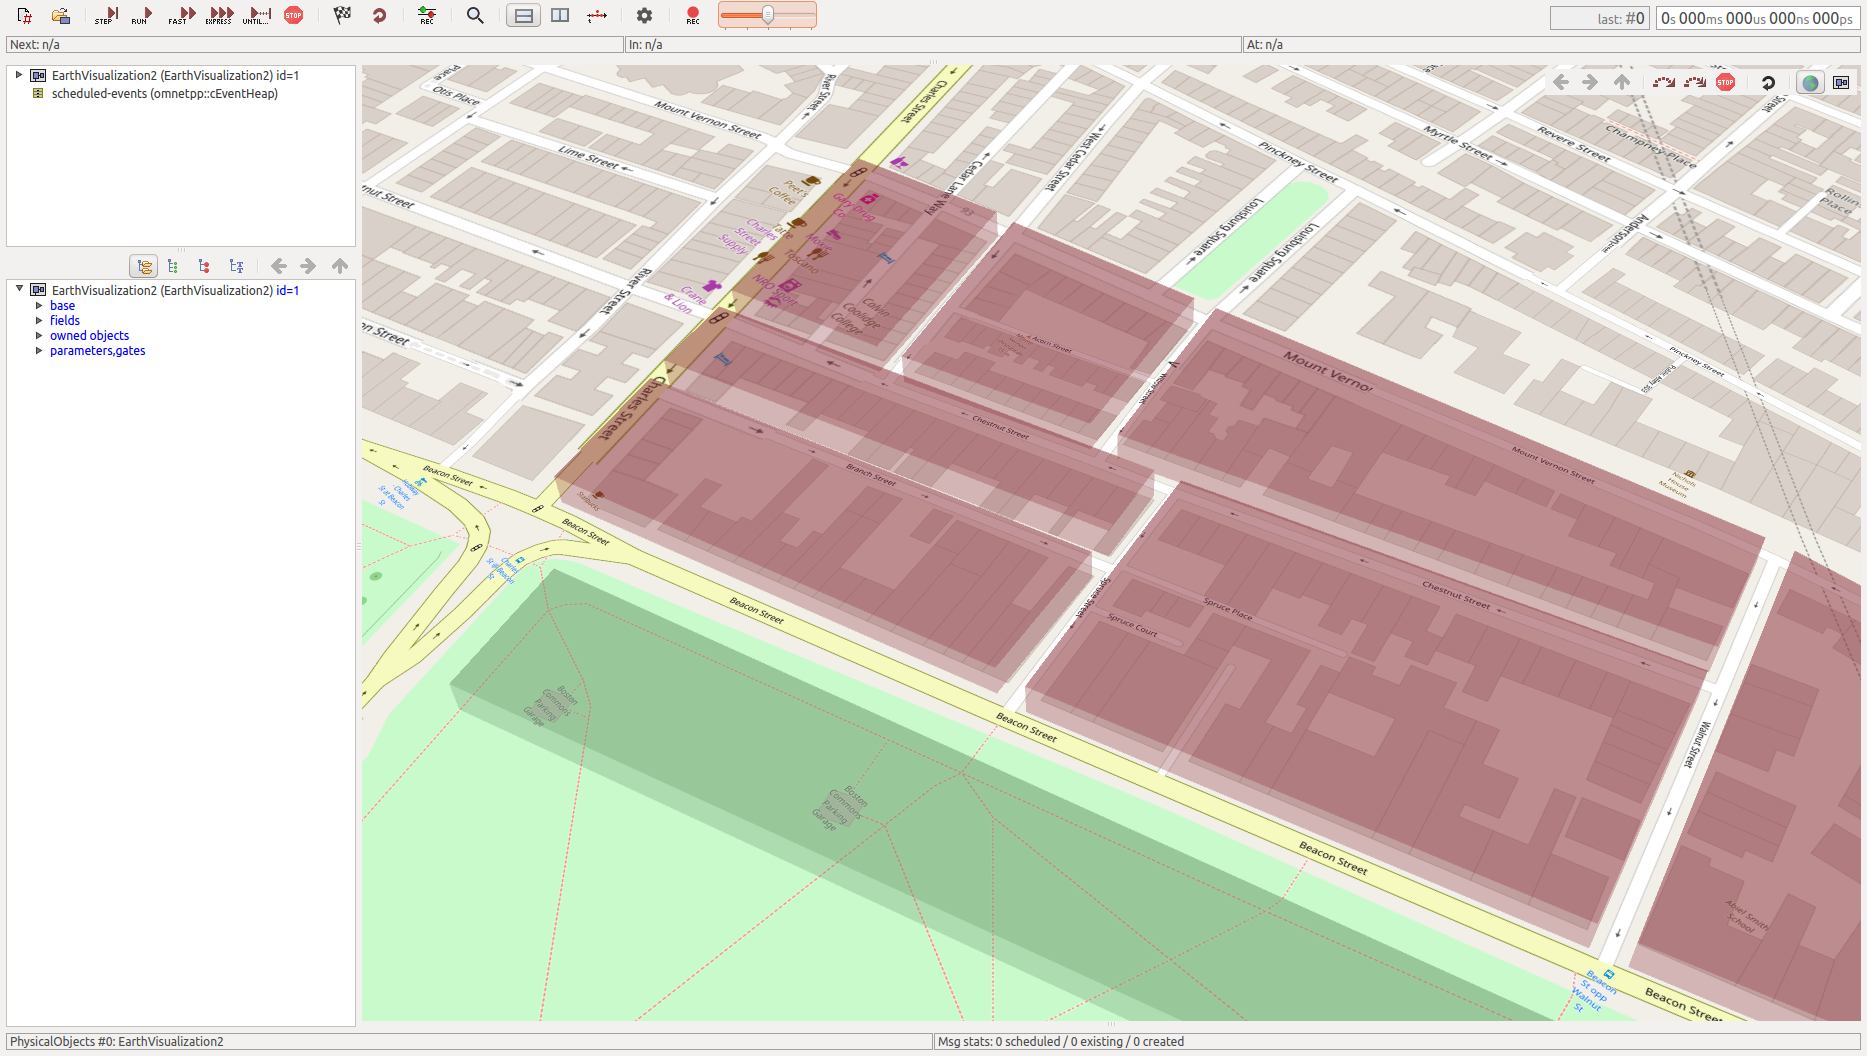
The scene looks like the following when the simulation is run. The objects that represent blocks of buildings are displayed as semi-transparent red blocks, and the group of trees at the park’s edge is displayed as a semi-transparent green block.
Placing Network Nodes on the Map
This example configuration demonstrates the placement of network nodes
on the map. The simulation can be run by choosing the NetworkNodes
configuration from the ini file. The network for this configuration
extends the previous network with a radio medium and a network
configurator module. It also adds four AdhocHost’s:
The configuration extends the previous configuration with the following:
*.visualizer.osgVisualizer.sceneVisualizer.sceneShading = false
*.visualizer.osgVisualizer.sceneVisualizer.sceneColor = "#000000"
*.visualizer.osgVisualizer.sceneVisualizer.sceneOpacity = 0.1

# Coordinate system settings
*.coordinateSystem.sceneAltitude = 1m
*.coordinateSystem.sceneHeading = 68.3deg

# Mobility settings
*.host*.mobility.typename = "StationaryMobility"
*.host*.mobility.coordinateSystemModule = "coordinateSystem"
*.host*.mobility.initialAltitude = 1m
*.host*.mobility.initFromDisplayString = false

# Node position settings
*.host1.mobility.initialLatitude = 42.35659deg
*.host1.mobility.initialLongitude = -71.06762deg

*.host2.mobility.initialLatitude = 42.35585deg
*.host2.mobility.initialLongitude = -71.06727deg

*.host3.mobility.initialLatitude = 42.35716deg
*.host3.mobility.initialLongitude = -71.06911deg

*.host4.mobility.initialLatitude = 42.35685deg
*.host4.mobility.initialLongitude = -71.06639deg
The first block of lines configures the scene to be semi-transparent black so that the underlying map is visible. The next block sets the altitude of the scene. By default, the altitude is zero; we set it to one meter so that the nodes are not on the level of the ground. The heading is also specified so that the edges of the scene roughly align with the streets on the map.
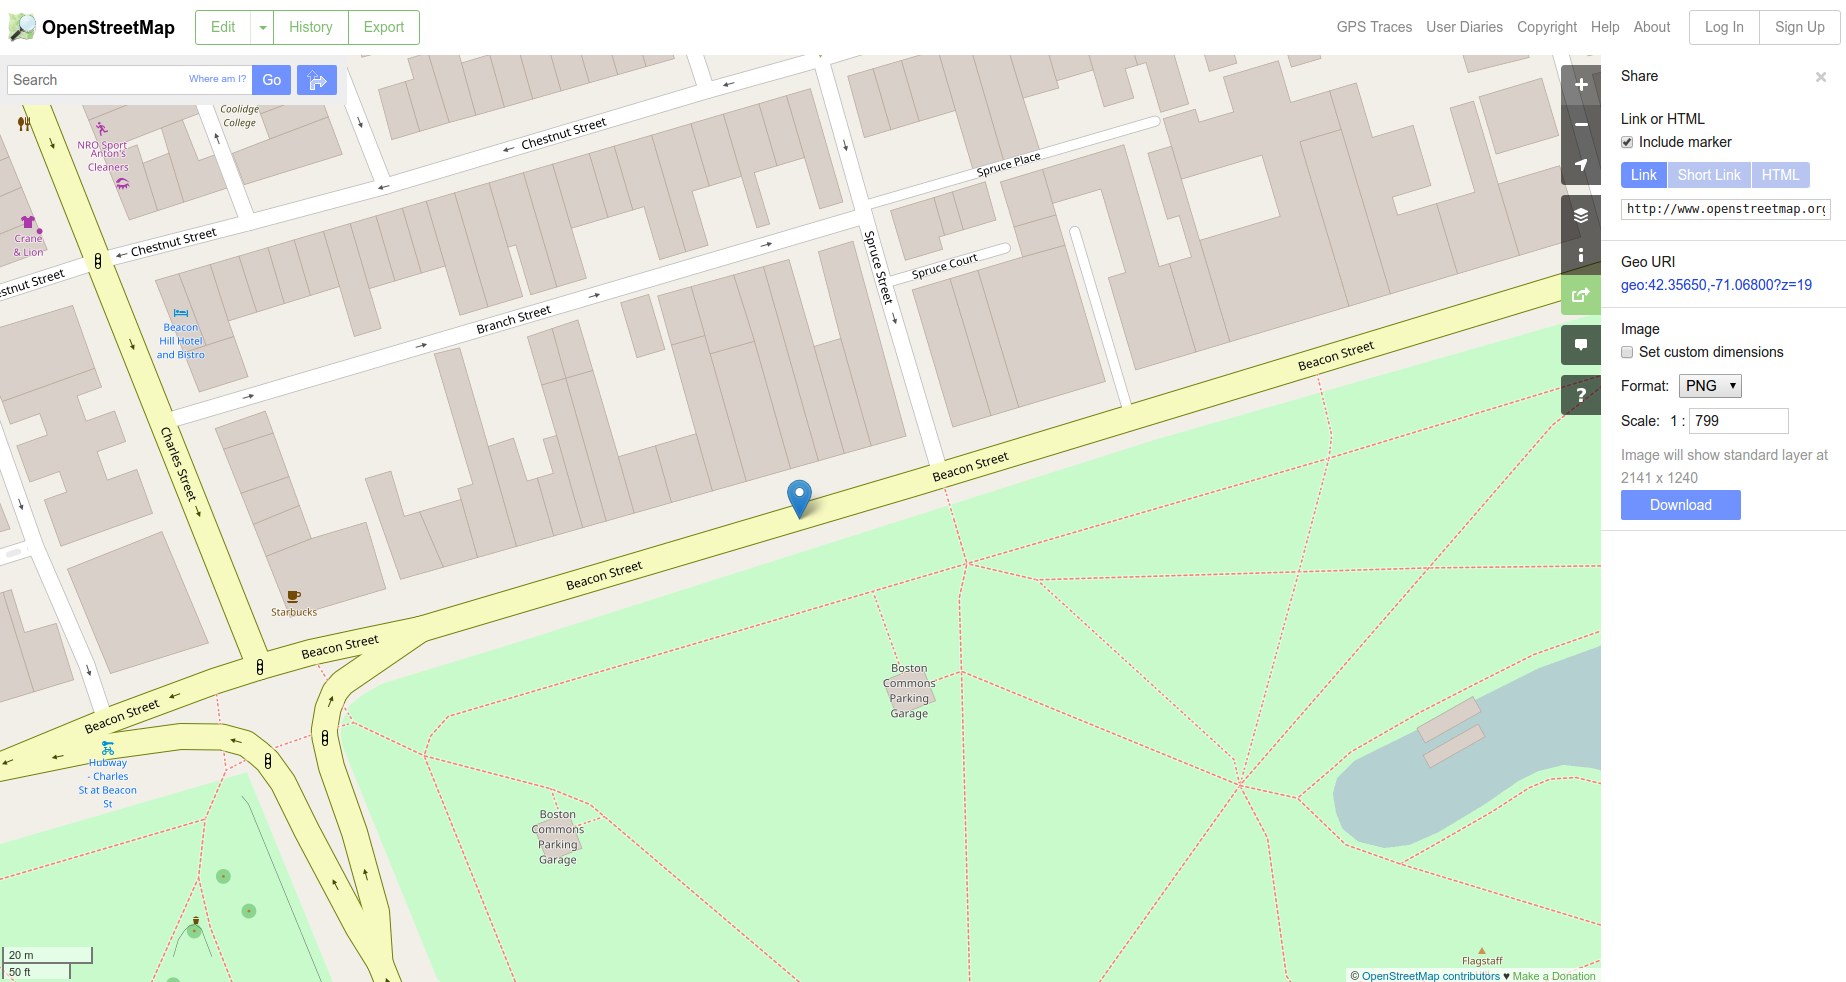
The rest of the configuration deals with placing the network nodes on the map. The mobility type of nodes is set to StationaryMobility, which is a mobility module that has parameters for positioning using geographical coordinates. The required latitude and longitude values can be obtained from www.openstreetmap.org. Once on that site, choose Share from the menu at the right, and tick Include marker. The marker can be dragged on the map, and the coordinates of the marker’s location can be read (and copy-pasted into the ini file) from the Share panel.
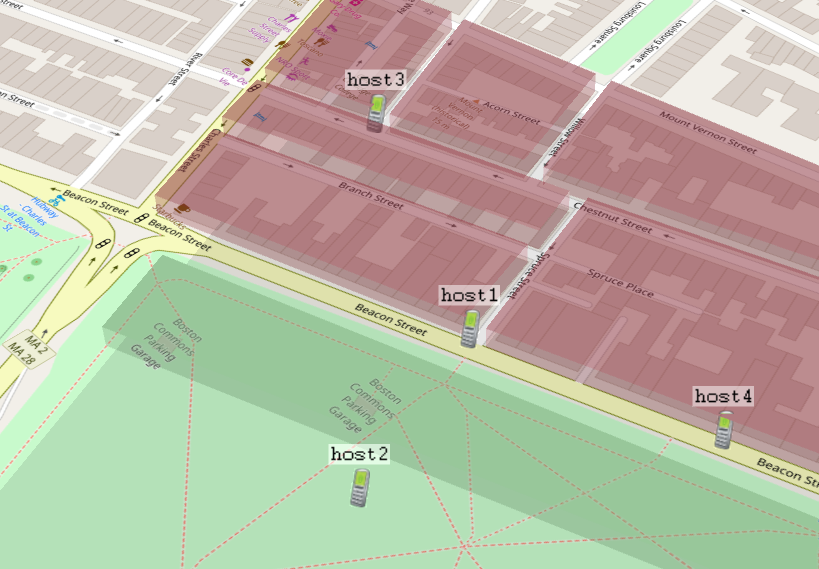
The scene with the nodes looks like the following when the simulation is run. The scene floor is visible against the map, and you can verify that the nodes have been placed at the specified coordinates.
Sources: omnetpp.ini, EarthVisualizationShowcase.ned
Further Information
For further information about the visualizer, refer to the NED documentation of SceneOsgEarthVisualizer and OsgGeographicCoordinateSystem.
Try It Yourself
First, install INET and OMNeT++. Then, start the IDE by typing
omnetpp, import the INET project into the IDE, then navigate to the
inet/showcases/visualizer/osg/earth folder in the Project Explorer. There, you can view
and edit the showcase files, run simulations, and analyze results.
Currently, opp_env-based installation is not available for the 3D visualization (OSG-based) showcases.
Discussion
Use this page in the GitHub issue tracker for commenting on this showcase.