Visualizing Physical Link Activity
Goals
Visualizing the network traffic activity in a simulation at various layers of the network stack is often useful for understanding and analyzing the network’s behavior. In this showcase, we will focus on PhysicalLinkVisualizer that provides graphical representation of the physical layer traffic in the form of arrows that fade as the traffic ceases.
This showcase consists of three simulation models that demonstrate the different capabilities of PhysicalLinkVisualizer.
4.0About the Visualizer
In INET, physical link activity can be visualized by including a
PhysicalLinkVisualizer module in the simulation. Adding an
IntegratedVisualizer module is also an option because it also
contains a PhysicalLinkVisualizer module. Physical link activity
visualization is disabled by default; it can be enabled by setting the
visualizer’s displayLinks parameter to true.
PhysicalLinkVisualizer observes frames that pass through the physical layer, i.e. are received correctly.
The activity between two nodes is represented visually by a dotted arrow which points from the sender node to the receiver node. The arrow appears after the first frame has been received, then gradually fades out unless it is refreshed by further frames. Color, fading time and other graphical properties can be changed with parameters of the visualizer.
By default, all packets, interfaces, and nodes are considered for the
visualization. This selection can be narrowed with the visualizer’s
packetFilter, interfaceFilter, and nodeFilter parameters.
Enabling Visualization of Physical Link Activity
The following example shows how to enable the visualization of physical
link activity with its default settings. In this example, we configure a
simulation for an ad-hoc wireless network. The simulation can be run by
choosing the EnablingVisualization configuration from the ini file.
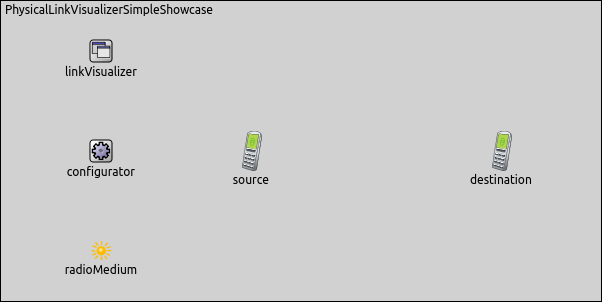
The network contains two AdhocHost’s, source and destination.
The linkVisualizer's type is PhysicalLinkVisualizer. In this
simulation, source will be pinging destination.
Physical link activity visualization is enabled by setting the
displayLinks parameter to true.
*.linkVisualizer.*.displayLinks = true
The following animation shows what happens when we start the simulation.
At the beginning of the animation, a red strip appears and moves from
source to destination. This strip is the standard OMNeT++
animation for packet transmissions and has nothing to do with
PhysicalLinkVisualizer. A blue dotted line also appears at the same
time. It can be ignored, as it is also part of the standard OMNeT++
animation for packet transmission. When the frame is received in whole
by destination (the red strip disappears), a dotted arrow is added
by PhysicalLinkVisualizer between the two hosts, indicating physical
link activity. The frame’s name is also displayed on the arrow. In this
simulation, the arrow fades out quickly, because the fadeOutTime
parameter of the visualizer is set to a small value.
Filtering Physical Link Activity
In complex networks with many nodes and several protocols in use, it is often useful to be able to filter network traffic and visualize only the part of the traffic we are interested in.
The following example shows how to set packet filtering. The simulation
can be run by choosing the Filtering configuration from the ini
file.
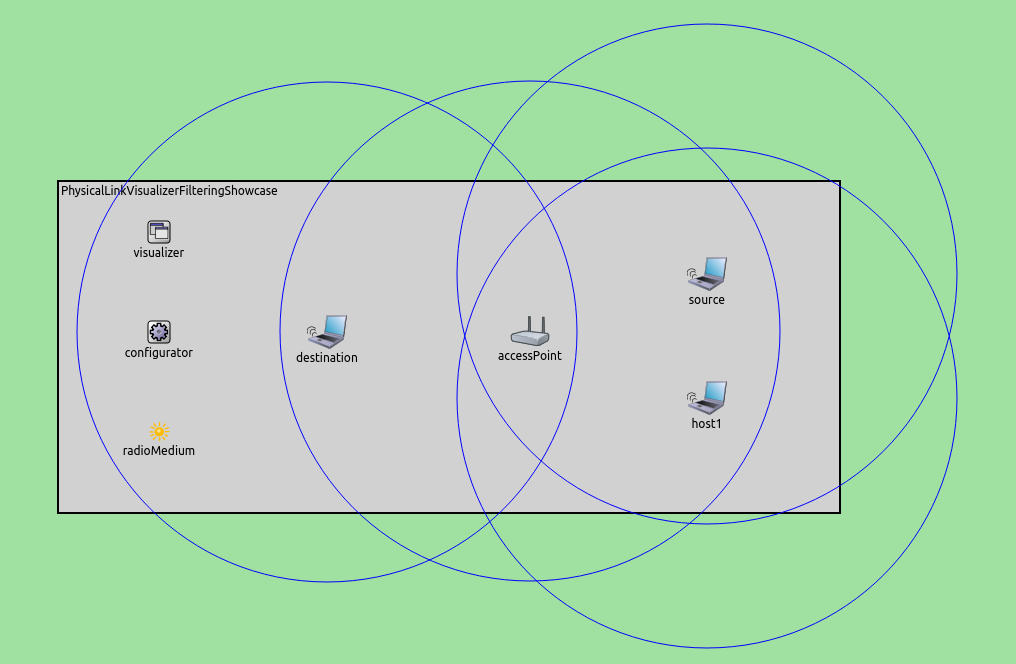
We have configured a wifi infrastructure mode network for this showcase.
The network consists of one accessPoint, and three wireless hosts,
source, destination, and host1. In this configuration, the
source host will be pinging the destination host. host1 does
not generate any traffic except for connecting to accessPoint.
The communication ranges of the nodes (blue circles in the picture) have
been reduced so that source and destination cannot receive
frames correctly from each other.
For this network, the type of visualizer module is
IntegratedVisualizer. Physical link activity visualization is
filtered to display only ping traffic. Other frames, e.g. Beacon frames
and ACK frames, are not displayed by PhysicalLinkVisualizer.
We use the following configuration for the visualization.
*.visualizer.*.physicalLinkVisualizer.displayLinks = true
*.visualizer.*.physicalLinkVisualizer.packetFilter = "ping*"
*.visualizer.*.physicalLinkVisualizer.fadeOutTime = 5s
The following video shows what happens when the simulation is run. The
video was captured from the point when the hosts had already associated
with accessPoint.
You can see that although there are also ACK frames, Beacon frames and
ping traffic in the network, PhysicalLinkVisualizer displays only
ping traffic, due to the presence of packetFilter. The ping frames travel
between source and destination through accessPoint, but
host1 also receives ping frames from accessPoint and source.
That is because host1 is within the communication range of
source and accessPoint.
Physical Link Activity in a Mobile Ad-Hoc Network
The goal of this simulation is to visualize dynamically changing
physical link activity in a mobile wireless environment. This simulation
can be run by choosing the Mobile configuration from the ini file.
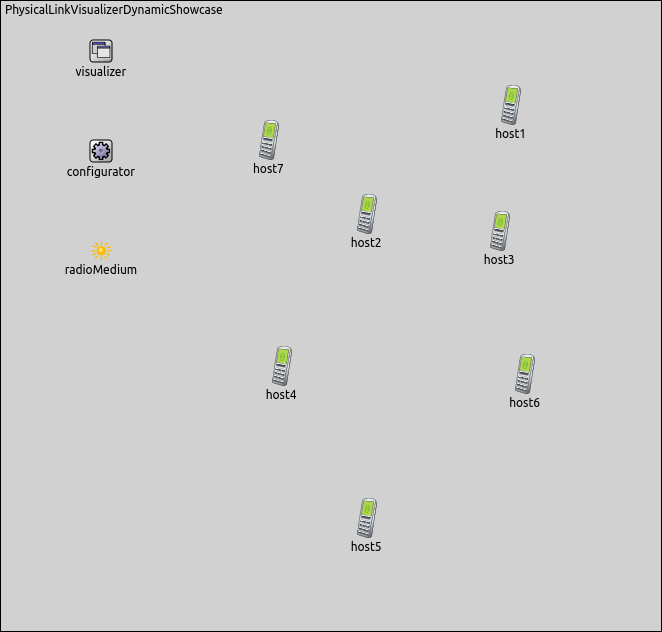
The network consists of seven nodes (host1..host7) of the type
AdhocHost. The nodes are placed randomly on the scene and will
also randomly roam within predefined borders. The communication range of
nodes is reduced so that nodes can typically communicate only with some
closer nodes.
The nodes send UDP packets in every second by using an UdpBasicApp
application. The packets’ names are set to Broadcast-nnn. The nodes
manage the received Broadcast packets using an UdpSink
application.
The visualizer’s packetFilter parameter is set to display only
Broadcast traffic.
Here is the configuration of the visualization.
*.visualizer.*.physicalLinkVisualizer.displayLinks = true
*.visualizer.*.physicalLinkVisualizer.packetFilter = "*Broadcast*"
*.visualizer.*.physicalLinkVisualizer.fadeOutMode = "simulationTime"
*.visualizer.*.physicalLinkVisualizer.fadeOutTime = 5s
The following video shows what happens when we run the simulation. (If the video does not show up, try refreshing the page with Ctrl+Shift+R.)
Here, physical link activity looks like a connection graph, where vertices are hosts, and each edge is physical link activity between two hosts. The graph is continually changing as a result of node movement. When two nodes drift away (out of the communication range of each other), the physical link between them breaks. When two nodes come close (move within each other’s communication range), there will be physical link activity between them again.
More Information
This example only demonstrates the key features of physical link visualization. For more information, refer to the PhysicalLinkVisualizer NED documentation.
Try It Yourself
If you already have INET and OMNeT++ installed, start the IDE by typing
omnetpp, import the INET project into the IDE, then navigate to the
inet/showcases/visualizer/canvas/physicallinkactivity folder in the Project Explorer. There, you can view
and edit the showcase files, run simulations, and analyze results.
Otherwise, there is an easy way to install INET and OMNeT++ using opp_env, and run the simulation interactively.
Ensure that opp_env is installed on your system, then execute:
$ opp_env run inet-4.0 --init -w inet-workspace --install --chdir \
   -c 'cd inet-4.0.*/showcases/visualizer/canvas/physicallinkactivity && inet'
This command creates an inet-workspace directory, installs the appropriate
versions of INET and OMNeT++ within it, and launches the inet command in the
showcase directory for interactive simulation.
Alternatively, for a more hands-on experience, you can first set up the workspace and then open an interactive shell:
$ opp_env install --init -w inet-workspace inet-4.0
$ cd inet-workspace
$ opp_env shell
Inside the shell, start the IDE by typing omnetpp, import the INET project,
then start exploring.


