Measuring Channel Utilization
Goals
In this example we explore the channel utilization statistics of wired and wireless transmission mediums.
4.6The Model
The channel utilization statistic is measured by observing the packets which are transmitted through the transmission medium over time. For both wired and wireless channels, the utilization is measured for any pair of communicating network interfaces, separately for both directions. This statistic expresses the relative usage of the channel with a value between 0 and 1, where 0 means the channel is not used at all and 1 means the channel is fully utilized.
Channel utilization is a statistic of transmitter modules, such as the PacketTransmitter in EthernetPhyLayer. The channel utilization is related to channel throughput in the sense that utilization is the ratio of throughput to channel datarate. By default, channel utilization is calculated for the past 0.1s or the last 100 packets, whichever comes first.
These values are configurable from the ini file with the interval ([s]) and numValueLimit parameters, as module.statistic.parameter.
For example:
*.host.eth[0].phyLayer.transmitter.utilization.interval = 0.2s
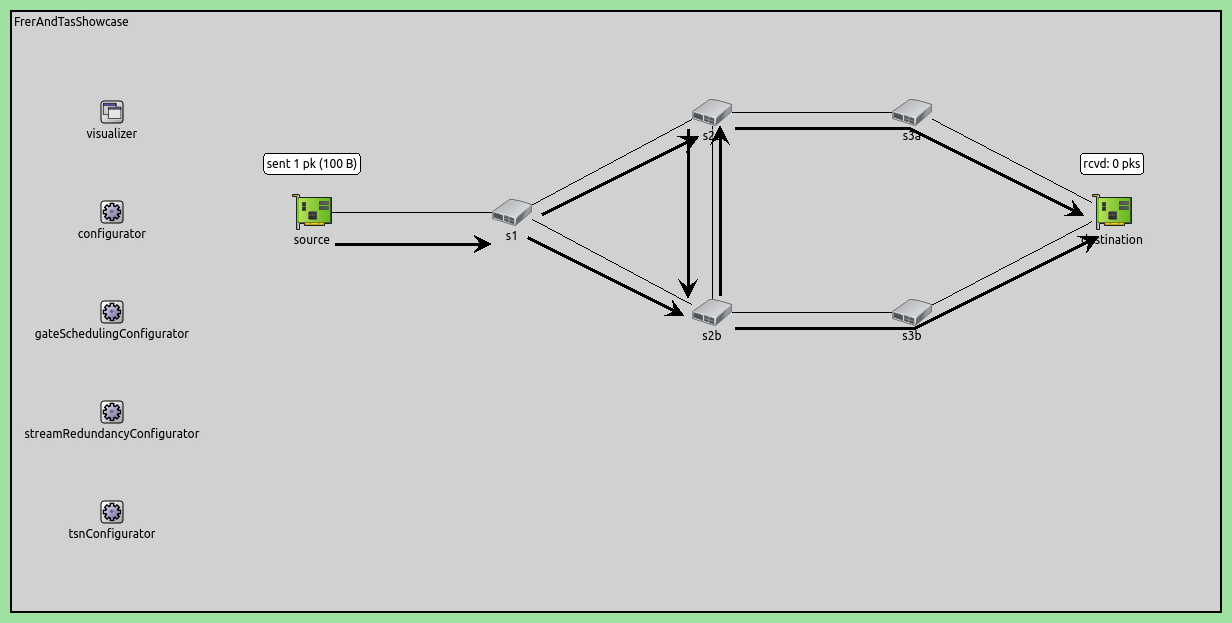
Here is the network:

The hosts are connected by 100 Mbps Ethernet.
We configure the hosts to use the layered Ethernet model, and the source host to generate UDP packets with around 48 Mbps. Here is the configuration:
[General]
network = ChannelUtilizationMeasurementShowcase
sim-time-limit = 1s

# source application with roughly ~48Mbps throughput
*.source.numApps = 1
*.source.app[0].typename = "UdpSourceApp"
*.source.app[0].source.packetLength = 1200B
*.source.app[0].source.productionInterval = exponential(200us)
*.source.app[0].io.destAddress = "destination"
*.source.app[0].io.destPort = 1000

# destination application
*.destination.numApps = 1
*.destination.app[0].typename = "UdpSinkApp"
*.destination.app[0].io.localPort = 1000

# enable modular Ethernet model
*.*.ethernet.typename = "EthernetLayer"
*.*.eth[*].typename = "LayeredEthernetInterface"

# data rate of all network interfaces
*.*.eth[*].bitrate = 100Mbps
Results
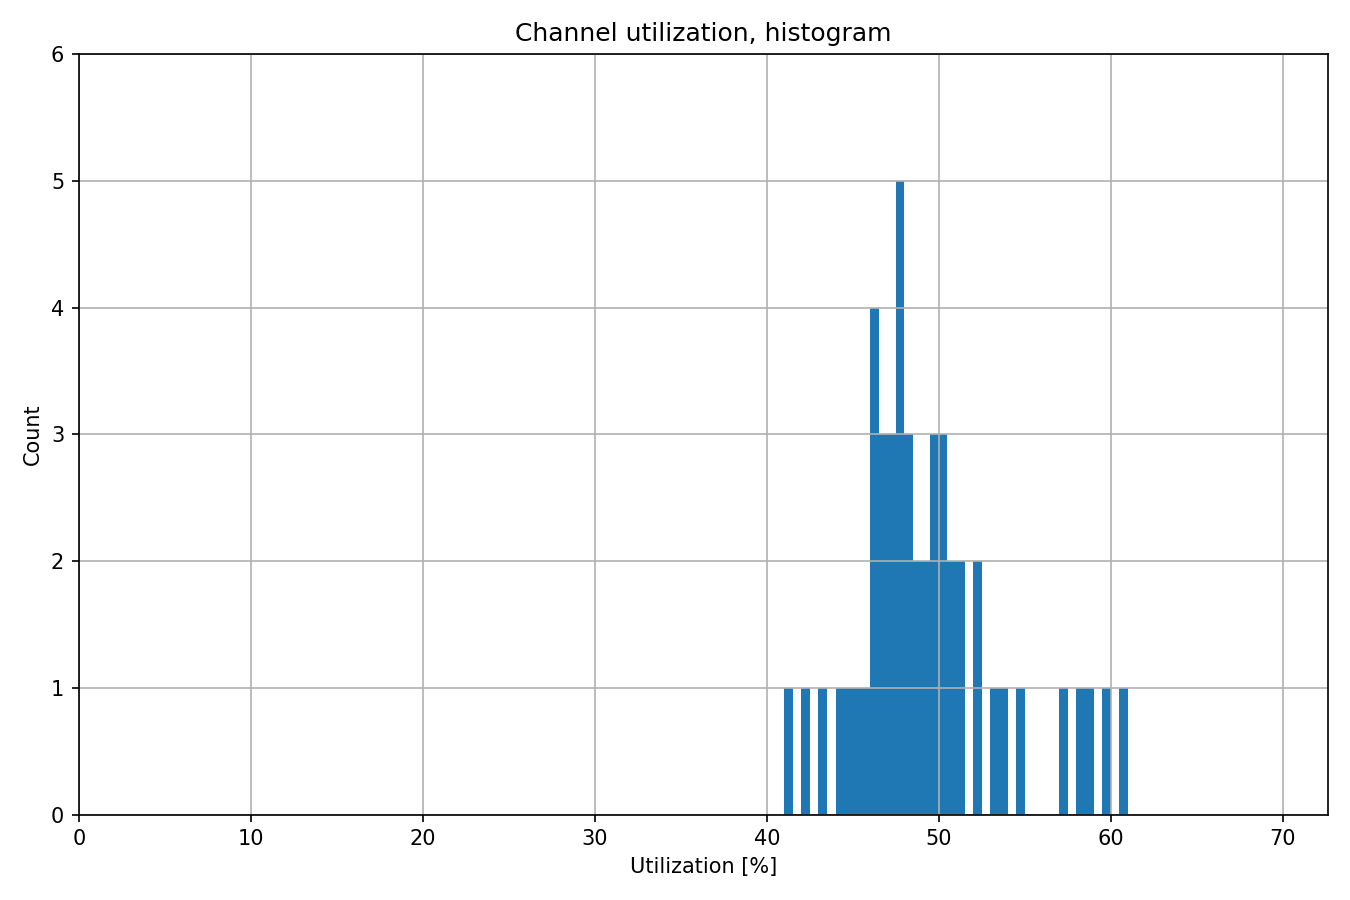
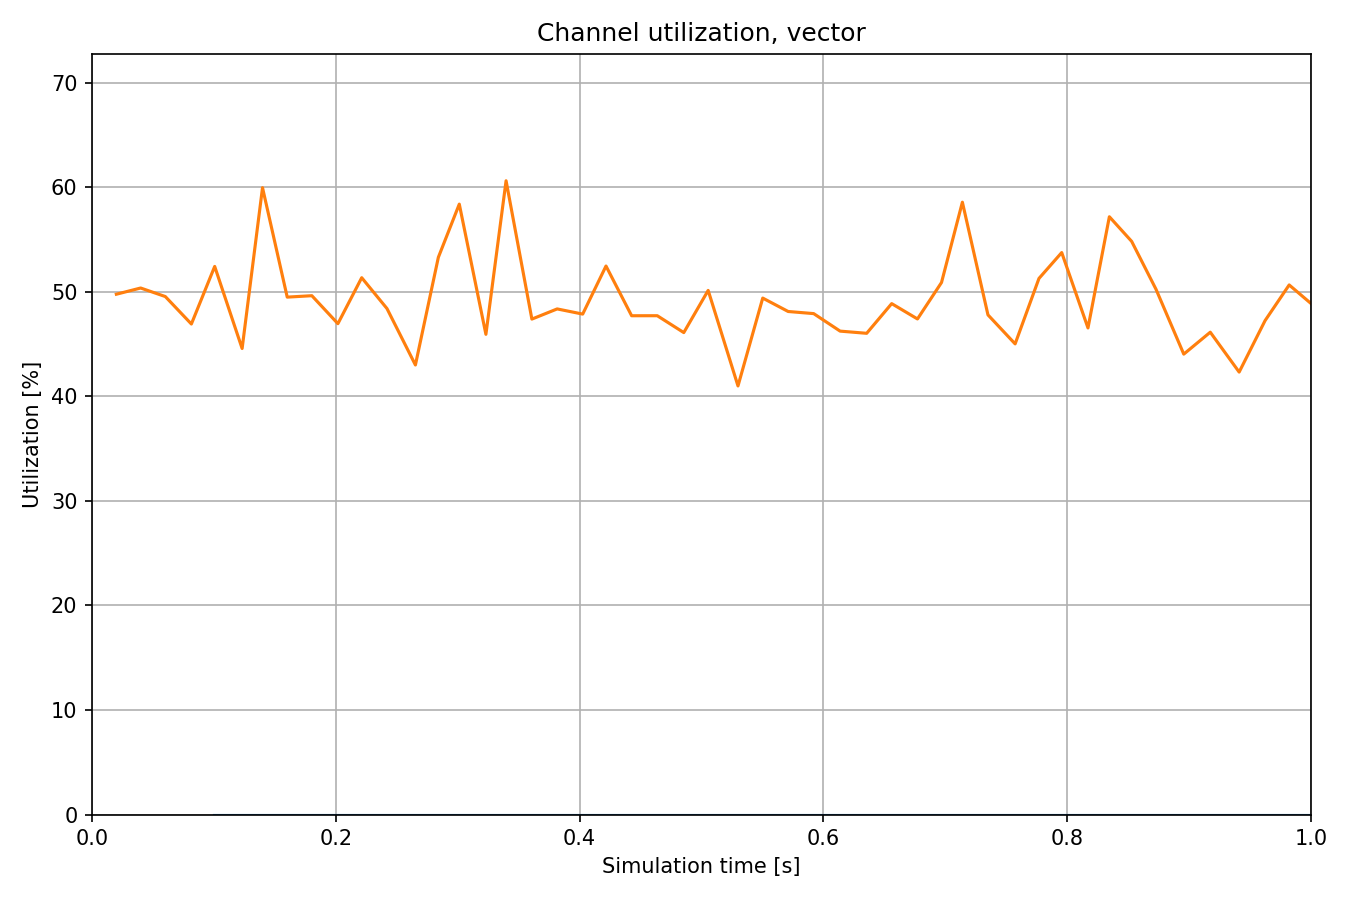
We measure the channel utilization in the source host (the source.eth[0].phyLayer.transmitter.utilization statistic). Here are the results:


Note
This is the channel utilization in the source -> destination direction. Utilization in the other direction on this link could be measured
with the utilization statistic in destination, but in this case there is no traffic in that direction.
Sources: omnetpp.ini, ChannelUtilizationMeasurementShowcase.ned
Try It Yourself
If you already have INET and OMNeT++ installed, start the IDE by typing
omnetpp, import the INET project into the IDE, then navigate to the
inet/showcases/measurement/utilization folder in the Project Explorer. There, you can view
and edit the showcase files, run simulations, and analyze results.
Otherwise, there is an easy way to install INET and OMNeT++ using opp_env, and run the simulation interactively.
Ensure that opp_env is installed on your system, then execute:
$ opp_env run inet-4.6 --init -w inet-workspace --install --build-modes=release --chdir \
   -c 'cd inet-4.6.*/showcases/measurement/utilization && inet'
This command creates an inet-workspace directory, installs the appropriate
versions of INET and OMNeT++ within it, and launches the inet command in the
showcase directory for interactive simulation.
Alternatively, for a more hands-on experience, you can first set up the workspace and then open an interactive shell:
$ opp_env install --init -w inet-workspace --build-modes=release inet-4.6
$ cd inet-workspace
$ opp_env shell
Inside the shell, start the IDE by typing omnetpp, import the INET project,
then start exploring.
Discussion
Use this page in the GitHub issue tracker for commenting on this showcase.