Measuring End-to-end Delay
Goals
In this example, we explore the end-to-end delay statistics of applications.
4.6The Model
The end-to-end delay is measured from the moment the packet leaves the source application to the moment the same packet arrives at the destination application.
The end-to-end delay is measured by the meanBitLifeTimePerPacket statistic.
The statistic measures the lifetime of the packet, i.e., time from creation in the source application
to deletion in the destination application.
Note
The meanBit part refers to the statistic being defined per bit, and the result is the mean of the per-bit values of all bits in the packet. When there is no packet streaming or fragmentation in the network, the bits of a packet travel together, so they have the same lifetime value.
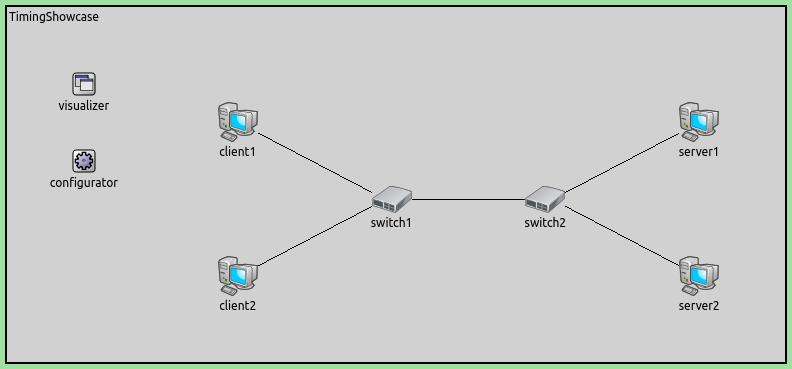
The simulations use a network with two hosts (StandardHost) connected via 100Mbps Ethernet:

We configure the packet source in the source host’s UDP app to generate 1200-Byte packets with a period of around 100us randomly. This corresponds to about 96Mbps of traffic. Here is the configuration:
[General]
network = EndToEndDelayMeasurementShowcase
description = "Measure packet end-to-end delay"
sim-time-limit = 1s

# source application ~96Mbps throughput
*.source.numApps = 1
*.source.app[0].typename = "UdpSourceApp"
*.source.app[0].source.packetLength = 1200B
*.source.app[0].source.productionInterval = exponential(100us)
*.source.app[0].io.destAddress = "destination"
*.source.app[0].io.destPort = 1000

# destination application
*.destination.numApps = 1
*.destination.app[0].typename = "UdpSinkApp"
*.destination.app[0].io.localPort = 1000

# enable modular Ethernet model
*.*.ethernet.typename = "EthernetLayer"
*.*.eth[*].typename = "LayeredEthernetInterface"

# data rate of all network interfaces
*.*.eth[*].bitrate = 100Mbps
Results
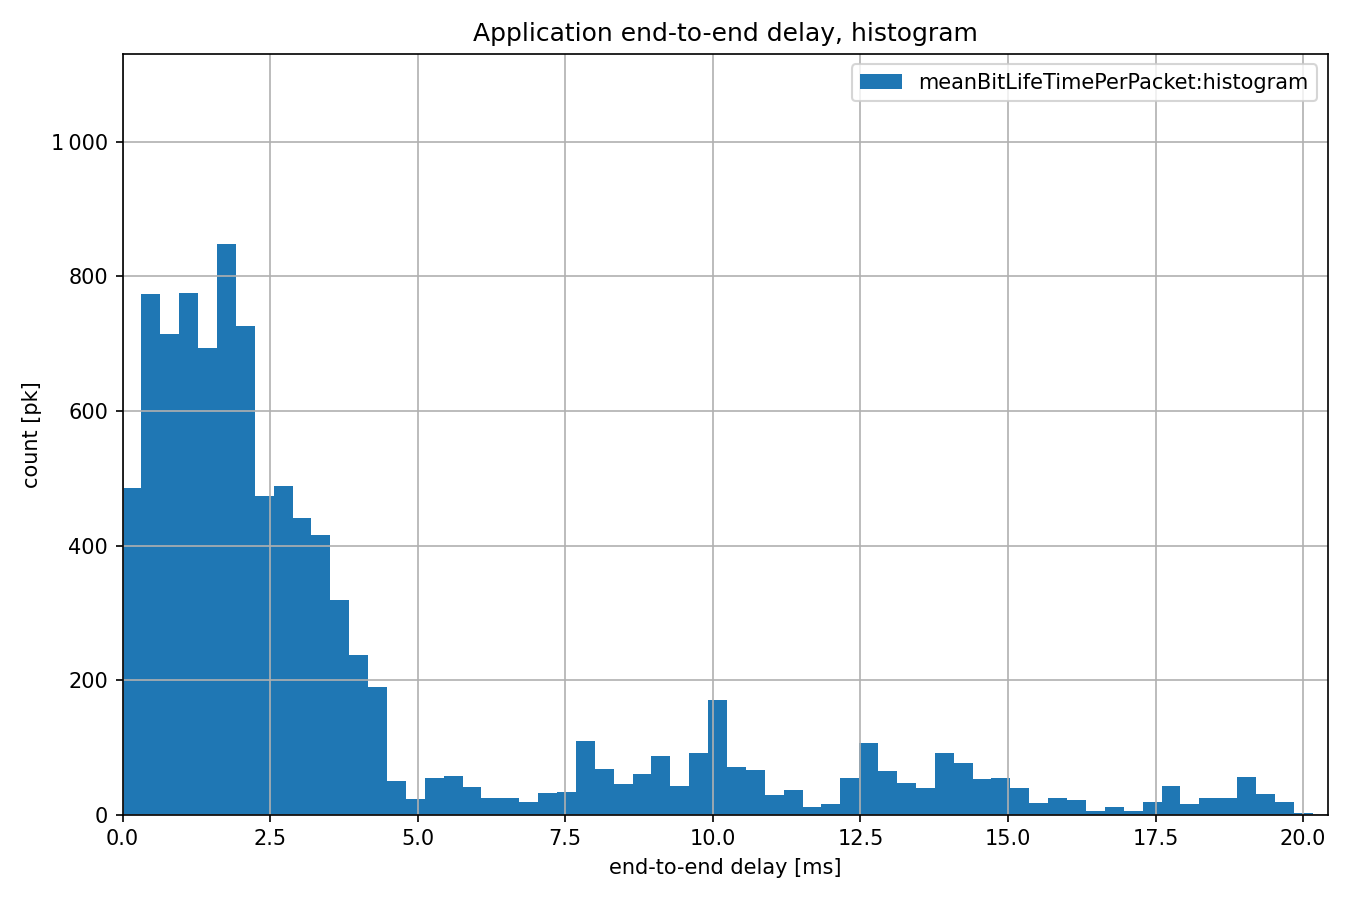
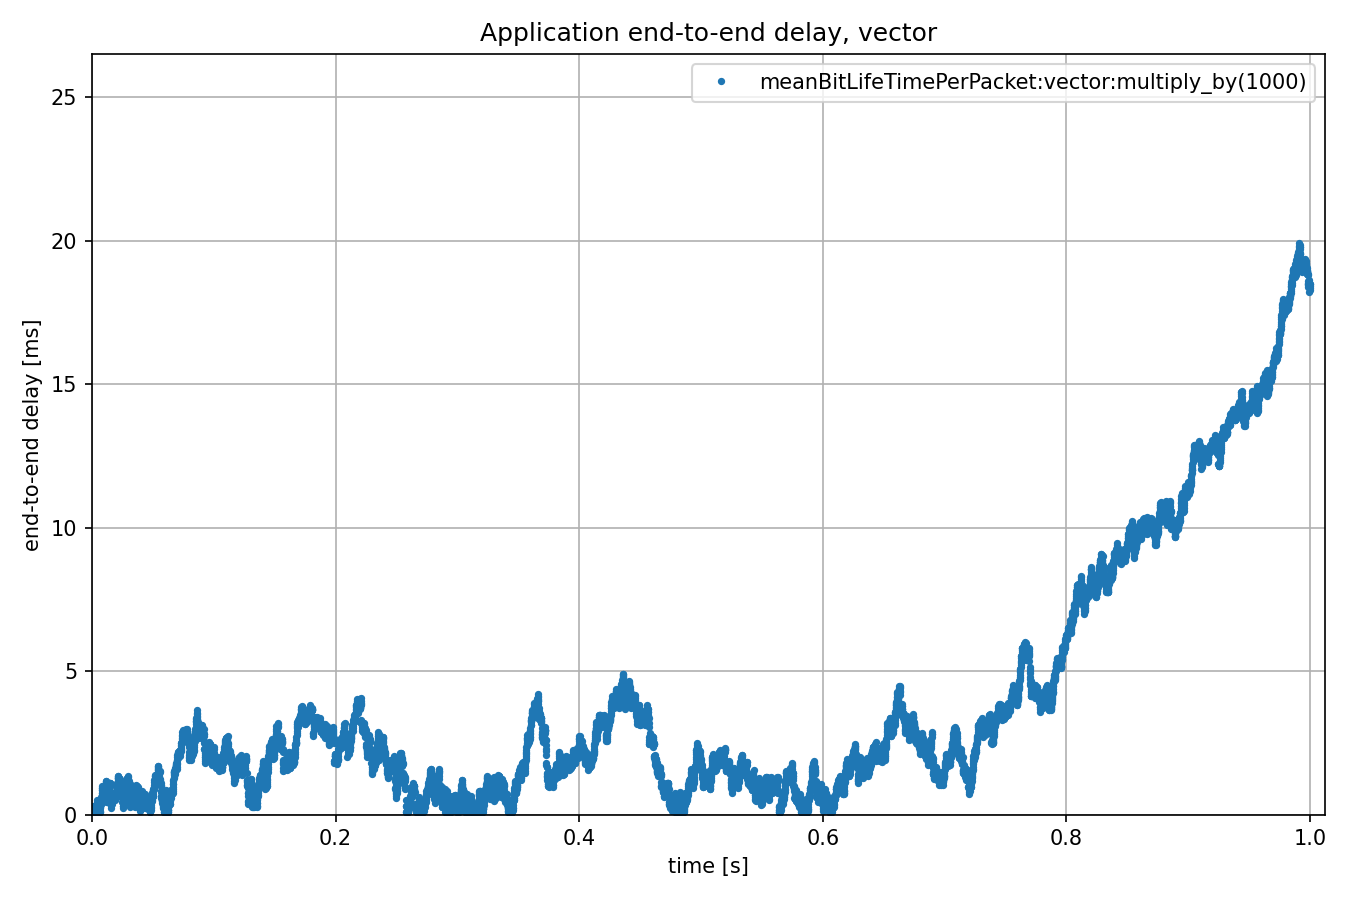
The traffic is around 96 Mbps, but the period is random. Thus, the traffic can be higher than the 100Mbps capacity of the Ethernet link. This might result in packets accumulating in the queue in the source host, and increased end-to-end delay (the queue length is unlimited by default).
To display the end-to-end delay, we plot the meanBitLifeTimePerPacket statistic in vector and histogram form:


The uptick towards the end of the simulation is due to packets accumulating in the queue.
Try It Yourself
If you already have INET and OMNeT++ installed, start the IDE by typing
omnetpp, import the INET project into the IDE, then navigate to the
inet/showcases/measurement/endtoenddelay folder in the Project Explorer. There, you can view
and edit the showcase files, run simulations, and analyze results.
Otherwise, there is an easy way to install INET and OMNeT++ using opp_env, and run the simulation interactively.
Ensure that opp_env is installed on your system, then execute:
$ opp_env run inet-4.6 --init -w inet-workspace --install --build-modes=release --chdir \
   -c 'cd inet-4.6.*/showcases/measurement/endtoenddelay && inet'
This command creates an inet-workspace directory, installs the appropriate
versions of INET and OMNeT++ within it, and launches the inet command in the
showcase directory for interactive simulation.
Alternatively, for a more hands-on experience, you can first set up the workspace and then open an interactive shell:
$ opp_env install --init -w inet-workspace --build-modes=release inet-4.6
$ cd inet-workspace
$ opp_env shell
Inside the shell, start the IDE by typing omnetpp, import the INET project,
then start exploring.
Discussion
Use this page in the GitHub issue tracker for commenting on this showcase.