Visualizing Transport Path Activity
Goals
INET offers a range of network traffic visualizers that operate at different levels of the network stack. In this showcase, we will focus on TransportRouteCanvasVisualizer that provides a graphical representation of transport layer traffic between two endpoints by displaying a polyline arrow along the path that fades as the traffic ceases.
This showcase contains two simulation models, each highlighting various aspects of the transport path activity visualizer, allowing for a comprehensive understanding of its features.
4.6About the Visualizer
In INET, transport path activity can be visualized by including a
TransportRouteCanvasVisualizer module in the simulation. Adding an
IntegratedCanvasVisualizer is also an option because it also contains a
TransportRouteCanvasVisualizer. Transport path activity visualization is
disabled by default, and it can be enabled by setting the visualizer’s
displayRoutes parameter to true.
TransportRouteCanvasVisualizer observes packets that pass through the transport layer, i.e., carry data from/to higher layers.
The activity between two nodes is represented visually by a polyline arrow which points from the source node to the destination node. TransportRouteCanvasVisualizer follows packets throughout their path so that the polyline goes through all nodes that are part of the path of packets. The arrow appears after the first packet has been received, then gradually fades out unless it is reinforced by further packets. Color, fading time, and other graphical properties can be changed with parameters of the visualizer.
By default, all packets and nodes are considered for the visualization.
This selection can be narrowed with the visualizer’s packetFilter
and nodeFilter parameters.
Enabling Visualization of Transport Path Activity
The following example shows how to enable transport path activity
visualization with its default settings. In the first example, we
configure a simulation for a wired network. This simulation can be run
by choosing the EnablingPathVisualizationWired configuration from
the ini file.
The wired network contains two connected StandardHost type nodes:
source and destination.
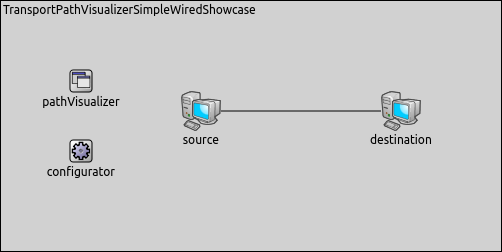
The source node will continuously send UDP packets to the
destination node by using a UdpBasicApp application.
In this simulation, the pathVisualizer's type is
TransportRouteCanvasVisualizer. It is enabled by setting the
displayRoutes parameter to true.
*.pathVisualizer.displayRoutes = true
The following video shows what happens when the simulation is run.
At the beginning of the video, a red strip appears and moves from
source to destination. This strip is the standard OMNeT++
animation for packet transmissions and has nothing to do with
TransportRouteCanvasVisualizer. When the packet is received in whole by
destination (the red strip disappears), an arrow is added by
TransportRouteCanvasVisualizer between the two hosts, indicating transport
path activity. The packet’s name is also displayed above the arrow.
Note, however, that the ARP packets do not activate the visualization,
because ARP packets do not pass through the transport layer. The
transport path activity arrow fades out quickly because the
fadeOutTime parameter of the visualizer is set to a small value.
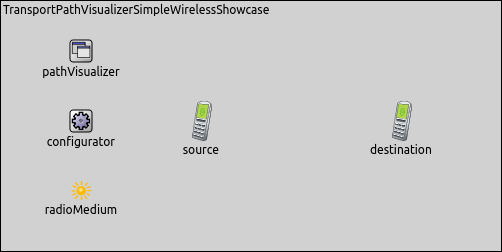
Our next simulation model is the wireless variant of the above example.
In this network, we use two AdhocHost’s. The traffic and the
visualization settings are the same as the configuration of the wired
example. The simulation can be run by choosing the
EnablingPathVisualizationWireless configuration from the ini file.
Here is the network for the wireless configuration.
The following video shows what happens when the simulation is run.
This animation is similar to the video of the wired example (apart from an extra blue dotted line which is also part of the standard OMNeT++ packet animation). Note, however, that the ACK and ARP frames do not activate the visualization because these frames do not pass through the transport layer.
Filtering Transport Path Activity
In complex networks where many nodes and several protocols are used, it is often useful to be able to filter network traffic and visualize only the part of the network traffic we are interested in.
In this simulation, we show how to use packetFilter and
nodeFilter. The simulation can be run by choosing the Filtering
configuration from the ini file.
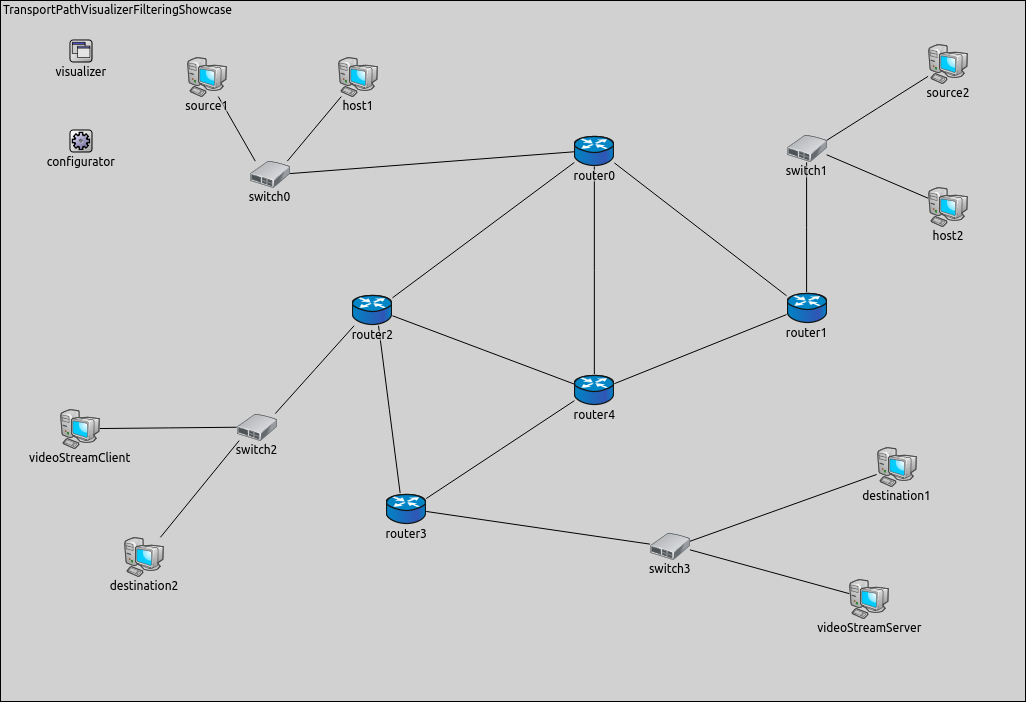
We set up a complex network with five Router modules
(router0..router4), four EthernetSwitch modules (switch0..switch4)
and eight endpoints. The source nodes (source1 and source2) are
continuously generating traffic by a UdpBasicApp application, which
is handled by a UdpSink application in the destination nodes
(destination1 and destination2). VideoStreamServer streams
video (sends VideoStrmPK-frag packets) to videoStreamClient. The
remaining two endpoints (host1 and host2) are inactive in this
simulation.
In our first experiment, we want to observe the traffic generated by
UdpBasicApp. For this reason, we configure the visualizer’s
packetFilter parameter to display only the UDPBasicAppData
packets. Video stream traffic will not be visualized by transport path
activity visualizer. We adjust the visualizer’s fadeOutMode and the
fadeOutTime parameters so that the transport path activity arrow
does not fade out completely before the next UDPBasicAppData packet
arrives.
*.visualizer.transportRouteVisualizer.displayRoutes = true
*.visualizer.transportRouteVisualizer.fadeOutMode = "simulationTime"
*.visualizer.transportRouteVisualizer.fadeOutTime = 1.2s
*.visualizer.transportRouteVisualizer.packetFilter = "*UdpBasicAppData*"
The following video has been captured from the simulation and shows
what happens if packetFilter is set.
You can see that although there is both video stream and
UDPBasicAppData traffic in the network, TransportRouteCanvasVisualizer
displays only the latter, due to the presence of the packetFilter
parameter.
In the first experiment, we filtered network traffic based on packets.
In INET, it is also possible to filter traffic based on network nodes.
In our second experiment, we want to display traffic only between
source1 and destination1. For this reason, we set the
visualizer’s nodeFilter parameter to display only the part of the
traffic between source1 and destination1. packetFilter is
still enabled in this simulation so that the video stream will not be
visualized.
We add the following line to the configuration:
*.visualizer.transportRouteVisualizer.nodeFilter = "source1 or switch* or router* or destination1"
The following video has been captured from the simulation and shows
what happens if nodeFilter is set.
If you observe the default OMNeT++ packet transmission animation (red
stripes), you can see that although there is UDP data traffic between
both source-destination pairs, the traffic is visualized only
between source1 and destination1 because of the nodeFilter
parameter setting.
More Information
This example only demonstrates the key features of transport path visualization. For more information, refer to the TransportRouteCanvasVisualizer NED documentation.
Try It Yourself
If you already have INET and OMNeT++ installed, start the IDE by typing
omnetpp, import the INET project into the IDE, then navigate to the
inet/showcases/visualizer/canvas/transportpathactivity folder in the Project Explorer. There, you can view
and edit the showcase files, run simulations, and analyze results.
Otherwise, there is an easy way to install INET and OMNeT++ using opp_env, and run the simulation interactively.
Ensure that opp_env is installed on your system, then execute:
$ opp_env run inet-4.6 --init -w inet-workspace --install --build-modes=release --chdir \
   -c 'cd inet-4.6.*/showcases/visualizer/canvas/transportpathactivity && inet'
This command creates an inet-workspace directory, installs the appropriate
versions of INET and OMNeT++ within it, and launches the inet command in the
showcase directory for interactive simulation.
Alternatively, for a more hands-on experience, you can first set up the workspace and then open an interactive shell:
$ opp_env install --init -w inet-workspace --build-modes=release inet-4.6
$ cd inet-workspace
$ opp_env shell
Inside the shell, start the IDE by typing omnetpp, import the INET project,
then start exploring.
Discussion
Use this page in the GitHub issue tracker for commenting on this showcase.