Visualizing Transport Connections
Goals
In a complex network with many applications and a large number of nodes communicating, it can be challenging to keep track of all the active transport layer connections. Transport connection visualization makes it easier to identify the two endpoints of each connection by displaying a marker above the nodes. The markers appear in different colors to allow differentiating between connections.
In this showcase, we will present two example simulations that demonstrate the visualization of TCP connections.
3.6About the visualizer
The TransportConnectionVisualizer module (also part of IntegratedCanvasVisualizer) displays color-coded icons above the two endpoints of an active, established transport layer level connection. The icons will appear when the connection is established and disappear when it is closed. Naturally, there can be multiple connections open at a node, thus there can be multiple icons. Icons have the same color at both ends of the connection. In addition to colors, letter codes (A, B, AA, etc.) may also be displayed to help in identifying connections. Note that this visualizer does not display the paths the packets take. If you are interested in that, take a look at TransportRouteVisualizer, covered in the Visualizing Transport Path Activity showcase.
The visualization is turned off by default; it can be turned on by
setting the displayTransportConnections parameter of the visualizer
to true.
It is possible to filter the connections being visualized. By default,
all connections are included. Filtering by hosts and port numbers can be
achieved by setting the sourcePortFilter, destinationPortFilter,
sourceNodeFilter, and destinationNodeFilter parameters.
The icon, colors, and other visual properties can be configured by setting the visualizer’s parameters.
Enabling the visualization of transport connections
The first example simulation, configured in the
EnablingVisualization section of the ini file, demonstrates the
visualization with default settings. This example simulation uses the
following network:
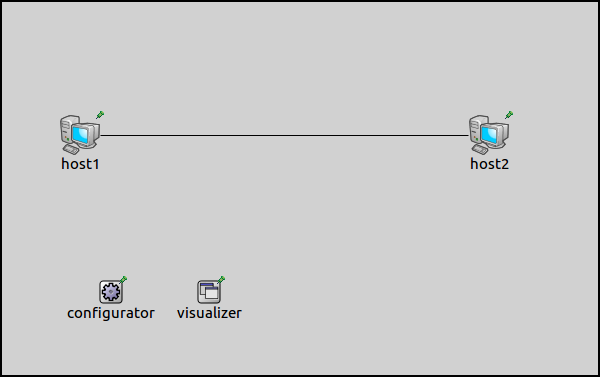
The network contains two StandardHost’s connected to each other, each
containing a TCP application. IP addresses and routing tables are
configured by an Ipv4NetworkConfigurator module. The visualizer
module is an IntegratedCanvasVisualizer. The application in
host1 is configured to open a TCP connection to host2 and send
data to it. The visualization of transport connections is enabled with
the visualizer’s displayTransportConnections parameter:
*.visualizer.displayTransportConnections = true
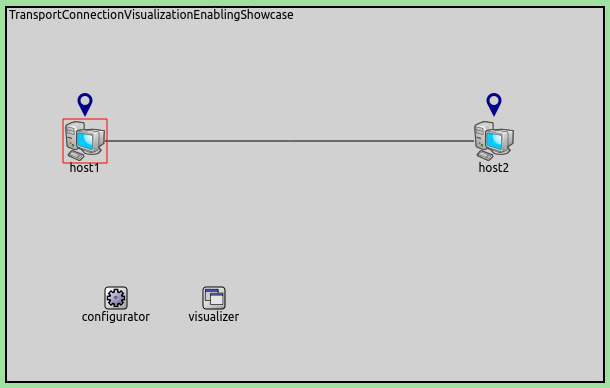
After the simulation is run for a while and the TCP connection is established, the icons representing the endpoints of the TCP connection will appear above the hosts. The network will look like the following:
Multiple transport connections
The following example simulation demonstrates the visualization of
multiple connections and the filtering by node and port number. The
simulation can be run by choosing the MultipleConnections
configuration from the ini file. It uses the following network:
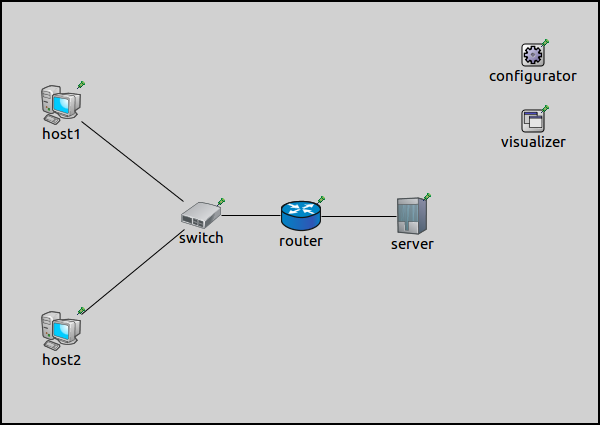
There are two StandardHost’s connected to a switch, which is connected via a router to the server, another StandardHost. IP addresses and routing tables are configured by an Ipv4NetworkConfigurator module. The visualizer module is an IntegratedCanvasVisualizer.
The hosts are configured to open TCP connections to the server:
host1: two connections on port 80 (HTTP), one connection on port 22 (SSH)host2: one connection on port 80, another one connection on port 22
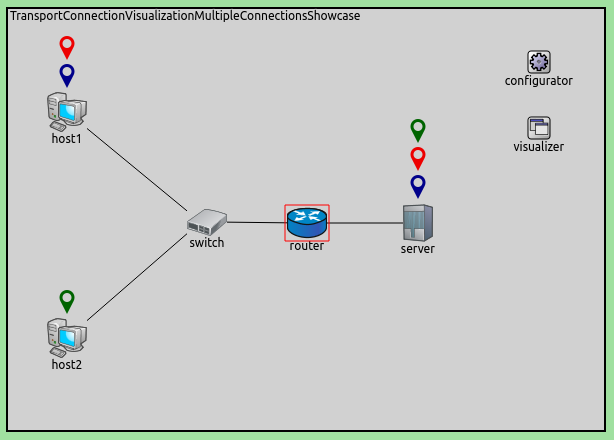
The visualizer is instructed to only visualize connections with the destination port 80:
*.visualizer.transportConnectionVisualizer.destinationPortFilter = "80"
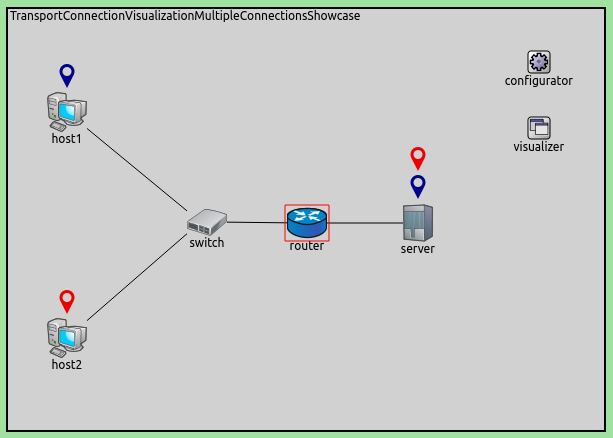
When the simulation is run, and the connections are established, the
network will look like the following. Note that there are several icons
above host1 and the server, indicating multiple connections.
Endpoints can be matched by color.
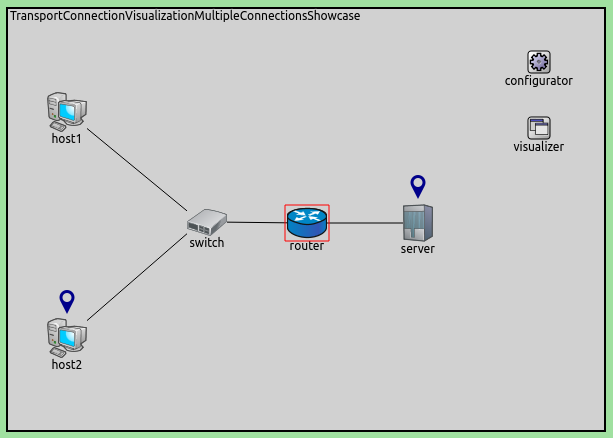
To visualize the connections that use port 22 at the server, the
destinationPortFilter should be set to 22. The network will look
like this:
Additionally, to visualize port 22 connections at host2 only, the
sourceNodeFilter parameter should be set to host2. The result
looks like this:
Sources: omnetpp.ini, TransportConnectionVisualizationShowcase.ned
Further information
For more information, refer to the TransportConnectionVisualizer NED documentation.
Try It Yourself
If you already have INET and OMNeT++ installed, start the IDE by typing
omnetpp, import the INET project into the IDE, then navigate to the
inet/showcases/visualizer/canvas/transportconnection folder in the Project Explorer. There, you can view
and edit the showcase files, run simulations, and analyze results.
Otherwise, there is an easy way to install INET and OMNeT++ using opp_env, and run the simulation interactively.
Ensure that opp_env is installed on your system, then execute:
$ opp_env run inet-4.6 --init -w inet-workspace --install --build-modes=release --chdir \
   -c 'cd inet-4.6.*/showcases/visualizer/canvas/transportconnection && inet'
This command creates an inet-workspace directory, installs the appropriate
versions of INET and OMNeT++ within it, and launches the inet command in the
showcase directory for interactive simulation.
Alternatively, for a more hands-on experience, you can first set up the workspace and then open an interactive shell:
$ opp_env install --init -w inet-workspace --build-modes=release inet-4.6
$ cd inet-workspace
$ opp_env shell
Inside the shell, start the IDE by typing omnetpp, import the INET project,
then start exploring.
Discussion
Use this page in the GitHub issue tracker for commenting on this showcase.