Token-Bucket-Based Policing
Goals
In shared network environments, misbehaving traffic sources can disrupt other applications. For example, when a client generates excessive traffic that exceeds available bandwidth, it can disrupt traffic from other clients sharing the same network infrastructure.
This problem is particularly critical in Time-Sensitive Networking (TSN) environments where predictable and reliable communication is essential for real-time applications. Per-stream filtering and policing provides an effective solution by limiting excessive traffic and protecting well-behaved streams from disruption, ensuring fair resource allocation across different streams.
This showcase demonstrates per-stream policing in TSN using a token bucket mechanism. Token bucket policing provides a deterministic method for traffic control that enforces long-term bandwidth limits while allowing controlled short-term traffic bursts. The scenario implements two clients: one generating excessive traffic and another generating normal traffic. We show how token bucket policing effectively limits the excessive traffic while allowing normal traffic to flow unimpeded.
4.6Background
Stream Filtering and Policing
Stream filtering and policing limit excessive traffic from misbehaving network devices to prevent disruption of well-behaved devices. Unlike traffic shaping, which buffers excess packets for later transmission, policing immediately drops packets that exceed predefined rate limits.
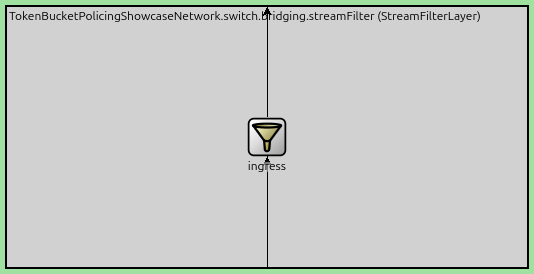
In INET, this functionality is implemented within the bridging layer of TsnSwitch modules through a StreamFilterLayer component. This layer contains SimpleIeee8021qFilter modules that can be configured as ingress filters, egress filters, or both.
Here is a StreamFilterLayer module with an ingress filter (in most cases, only the ingress filter is used):
For example, a SimpleIeee8021qFilter with 2 streams looks like the following:
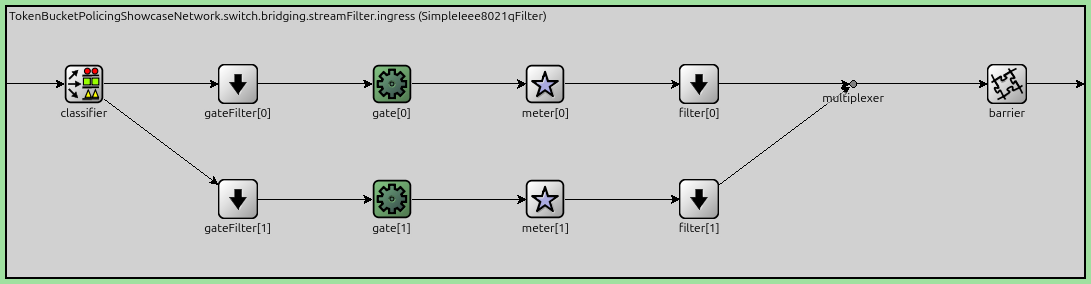
The SimpleIeee8021qFilter contains the following key submodules:
classifier: A StreamClassifier module by default that identifies incoming packets and dispatches them to the appropriate stream-specific processing path.
meter: A traffic meter for each stream that measures traffic rates and labels packets as either “green” (conforming) or “red” (non-conforming) based on predefined traffic parameters. They are DualRateThreeColorMeter by default.
filter: A traffic filter for each stream that drops red packets while allowing green packets to pass through. They are LabelFilter by default.
The type and configuration of the meter and filter modules implement the specific filtering mechanism (e.g. token-bucket-based, statistical). This architecture ensures that each stream is independently metered and policed according to its specific traffic parameters.
Token Bucket Algorithm
The token bucket algorithm is a deterministic traffic policing mechanism that operates using the following principles:
A virtual “bucket” stores tokens that are replenished at a constant rate called the Committed Information Rate (CIR)
The bucket has a maximum capacity equal to the Committed Burst Size (CBS)
When the bucket reaches full capacity, newly generated tokens overflow and are discarded
Each incoming packet consumes tokens proportional to its size from the bucket
Packets are forwarded only when sufficient tokens are available; consumed tokens are removed from the bucket
When insufficient tokens are available, packets are either dropped (policing) or marked as non-conforming
This mechanism provides:
Long-term rate control: Average traffic rate is limited to the CIR over time
Burst accommodation: Short bursts up to CBS bytes can exceed the CIR temporarily
Deterministic operation: Each packet has predictable pass/fail behavior based on current token availability
Single Rate Two Color Metering
The single rate two color meter is a specific implementation of the token bucket algorithm that works as follows:
Uses a single token bucket with the Committed Information Rate and Committed Burst Size parameters
Labels packets as either “green” (conforming) or “red” (non-conforming)
Green packets are forwarded, while red packets are typically dropped
The Model
This showcase uses a simple four-node network topology to demonstrate token bucket policing:
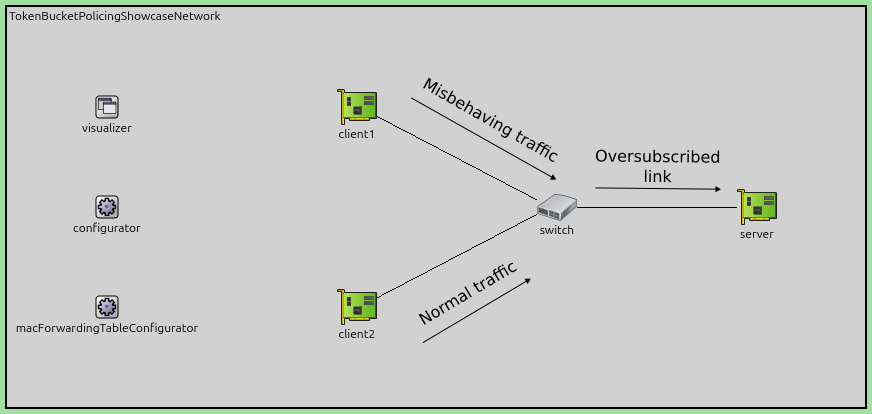
The network consists of two client devices that send traffic streams to a server through a TSN switch:
client1: Generates misbehaving traffic with varying, sometimes excessive data rates
client2: Generates well-behaved traffic with a steady data rate
switch: A TsnSwitch that implements token bucket policing to control traffic flows
server: Receives traffic from both clients
The combined traffic from both clients occasionally exceeds the link capacity between the switch and the server, creating congestion. This scenario allows us to compare network behavior with and without token bucket policing enabled in the switch.
Traffic Configuration
The network topology consists of TsnDevice modules for clients and server, connected through a TsnSwitch via 100 Mbps EthernetLink channels.
Traffic Patterns:
client1: Generates misbehaving traffic at an average rate of 40 Mbps using sinusoidal packet intervals, creating variable, bursty traffic patterns that periodically exceed the committed rateclient2: Generates well-behaved traffic at a steady 20 Mbps with consistent packet intervals
# configure client applications
*.client*.numApps = 1
*.client*.app[*].typename = "UdpSourceApp"
*.client1.app[0].display-name = "misbehaving traffic"
*.client2.app[0].display-name = "normal traffic"
*.client*.app[*].io.destAddress = "server"
*.client1.app[0].io.destPort = 1000
*.client2.app[0].io.destPort = 1001
*.client1.app[0].io.displayStringTextFormat = "{numSent} misbehaving traffic"
*.client2.app[0].io.displayStringTextFormat = "{numSent} normal traffic"

# configure misbehaving traffic stream from ~40Mbps to ~110Mbps
*.client1.app[0].source.packetLength = 1000B
*.client1.app[0].source.productionInterval = 200us + replaceUnit(sin(dropUnit(simTime() * 10)), "ms") / 8

# configure normal traffic stream ~20Mbps
*.client2.app[0].source.packetLength = 500B
*.client2.app[0].source.productionInterval = 250us
Stream Identification and Classification
Traffic Classification: Both streams belong to the same traffic class, which is important for this demonstration. If they belonged to different traffic classes, TSN traffic shaping could resolve the issue by prioritizing traffic. Since both streams share the same class, they compete equally for bandwidth, making per-stream policing necessary to protect the well-behaved stream. This requires no explicit configuration.
Stream Identification: The system uses a two-stage identification process:
Clients identify outgoing packets by UDP destination port and encode them with VLAN IDs
The switch decodes VLAN IDs to classify incoming packets and apply appropriate policing policies
# enable outgoing streams
*.client*.hasOutgoingStreams = true

# configure client stream identification
*.client*.bridging.streamIdentifier.identifier.mapping = [{stream: "misbehaving traffic", packetFilter: expr(udp.destPort == 1000)},
                                                          {stream: "normal traffic", packetFilter: expr(udp.destPort == 1001)}]

# configure client stream encoding
*.client*.bridging.streamCoder.encoder.mapping = [{stream: "misbehaving traffic", vlan: 0},
                                                  {stream: "normal traffic", vlan: 4}]

# disable forwarding IEEE 802.1Q C-Tag
*.switch.bridging.directionReverser.reverser.excludeEncapsulationProtocols = ["ieee8021qctag"]

# configure stream decoding
*.switch.bridging.streamCoder.decoder.mapping = [{vlan: 0, stream: "misbehaving traffic"},
                                                 {vlan: 4, stream: "normal traffic"}]
Per-Stream Filtering
The per-stream ingress filtering dispatches the different streams to separate metering and filter paths:
*.switch.bridging.streamFilter.ingress.numStreams = 2
*.switch.bridging.streamFilter.ingress.hasDefaultPath = false
*.switch.bridging.streamFilter.ingress.classifier.mapping = {"misbehaving traffic": 0, "normal traffic": 1}
*.switch.bridging.streamFilter.ingress.meter[0].display-name = "misbehaving traffic"
*.switch.bridging.streamFilter.ingress.meter[1].display-name = "normal traffic"
Token Bucket Configuration
Each stream uses a SingleRateTwoColorMeter configured with stream-specific parameters to implement token bucket policing. The meter operates with two key parameters:
committedInformationRate(CIR): Token replenishment rateMisbehaving stream: 40 Mbps (matches average traffic rate)
Normal stream: 20 Mbps (matches steady traffic rate)
committedBurstSize(CBS): Maximum token bucket capacityMisbehaving stream: 10 kB (allows moderate bursts)
Normal stream: 5 kB (smaller burst allowance for steady traffic)
*.switch.bridging.streamFilter.ingress.meter[*].typename = "SingleRateTwoColorMeter"
*.switch.bridging.streamFilter.ingress.meter[0].committedInformationRate = 40Mbps
*.switch.bridging.streamFilter.ingress.meter[1].committedInformationRate = 20Mbps
*.switch.bridging.streamFilter.ingress.meter[0].committedBurstSize = 10kB
*.switch.bridging.streamFilter.ingress.meter[1].committedBurstSize = 5kB
The meter continuously replenishes tokens at the CIR rate. When packets arrive:
Green packets: Sufficient tokens available - packet forwarded, tokens consumed
Red packets: Insufficient tokens - packet marked for dropping by the LabelFilter
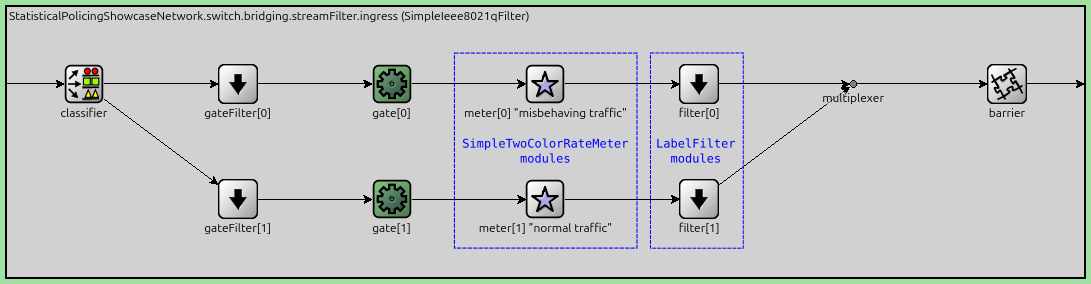
This configuration ensures long-term traffic rates do not exceed the CIR, while the CBS allows temporary bursts that consume accumulated tokens. The different CBS values reflect the distinct burst characteristics of each stream type.
The following figure illustrates the per-stream filtering architecture, showing how traffic is classified, metered, and filtered inside the bridging layer of the switch:
Results
Without Policing
The first three charts demonstrate the problem we are addressing: excessive, misbehaving traffic disrupting normal traffic in a shared network environment, without policing. Here is the traffic generated by the client:
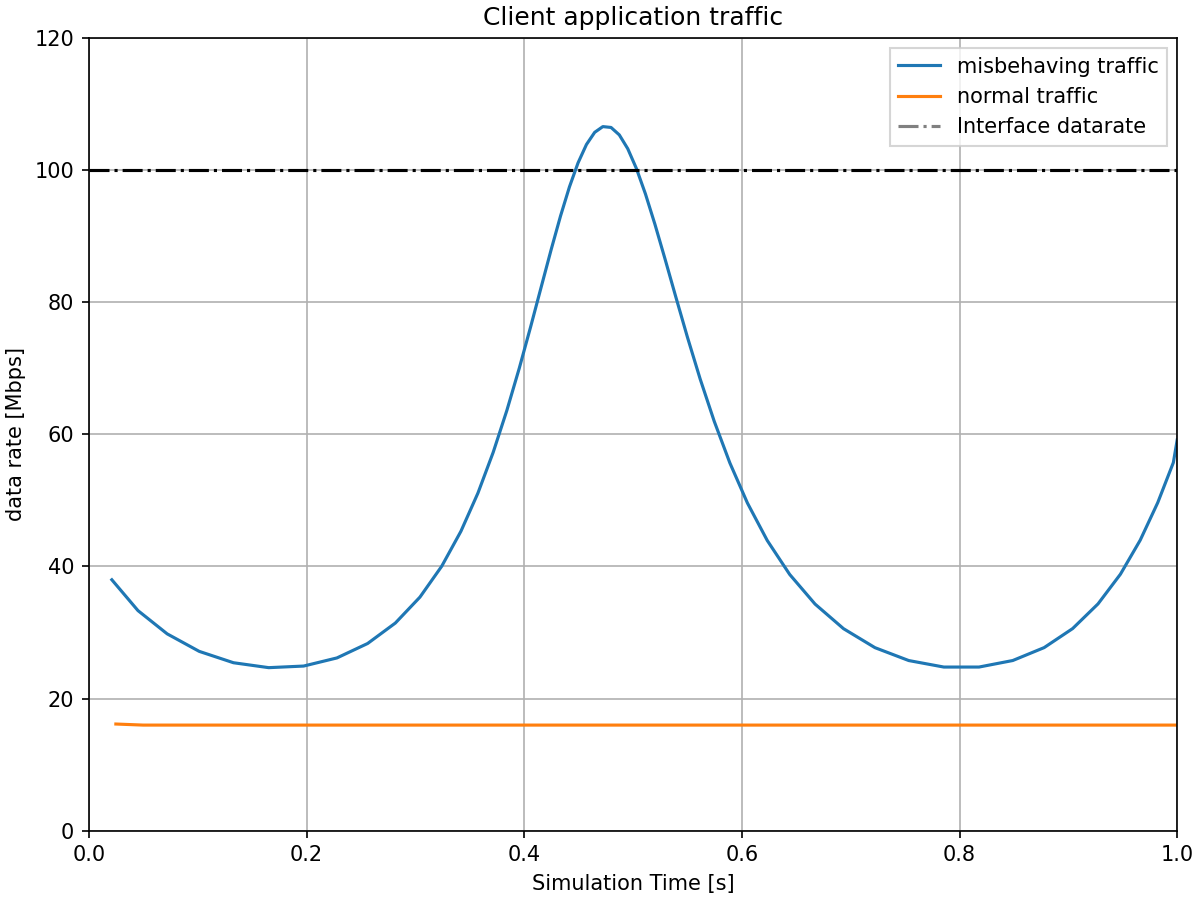
client1 generates the misbehaving traffic stream with an average rate around 40 Mbps but with
significant variation due to the sinusoidal packet interval pattern. The traffic
rate oscillates, creating natural bursts that exceed the configured committed
information rate. client2 generates steady normal traffic at approximately
20 Mbps. Together, the combined traffic can momentarily exceed the 100 Mbps link
capacity between the switch and server.
Here is the traffic received at the server:
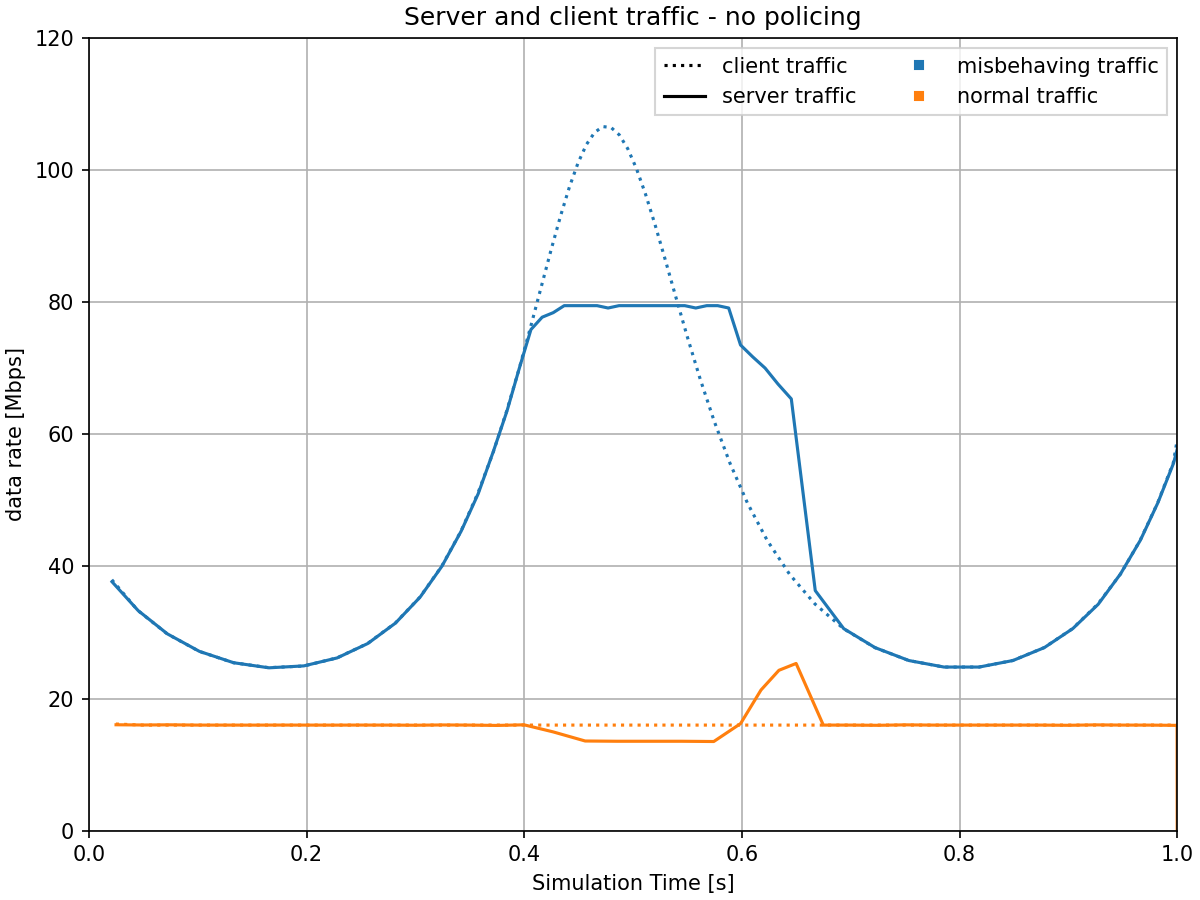
When the combined traffic exceeds the link capacity between the switch and the server, packets must queue at the switch, leading to delays. The misbehaving traffic competes with normal traffic for bandwidth, slowing it down.
The next chart shows the end-to-end delay of the normal traffic stream:
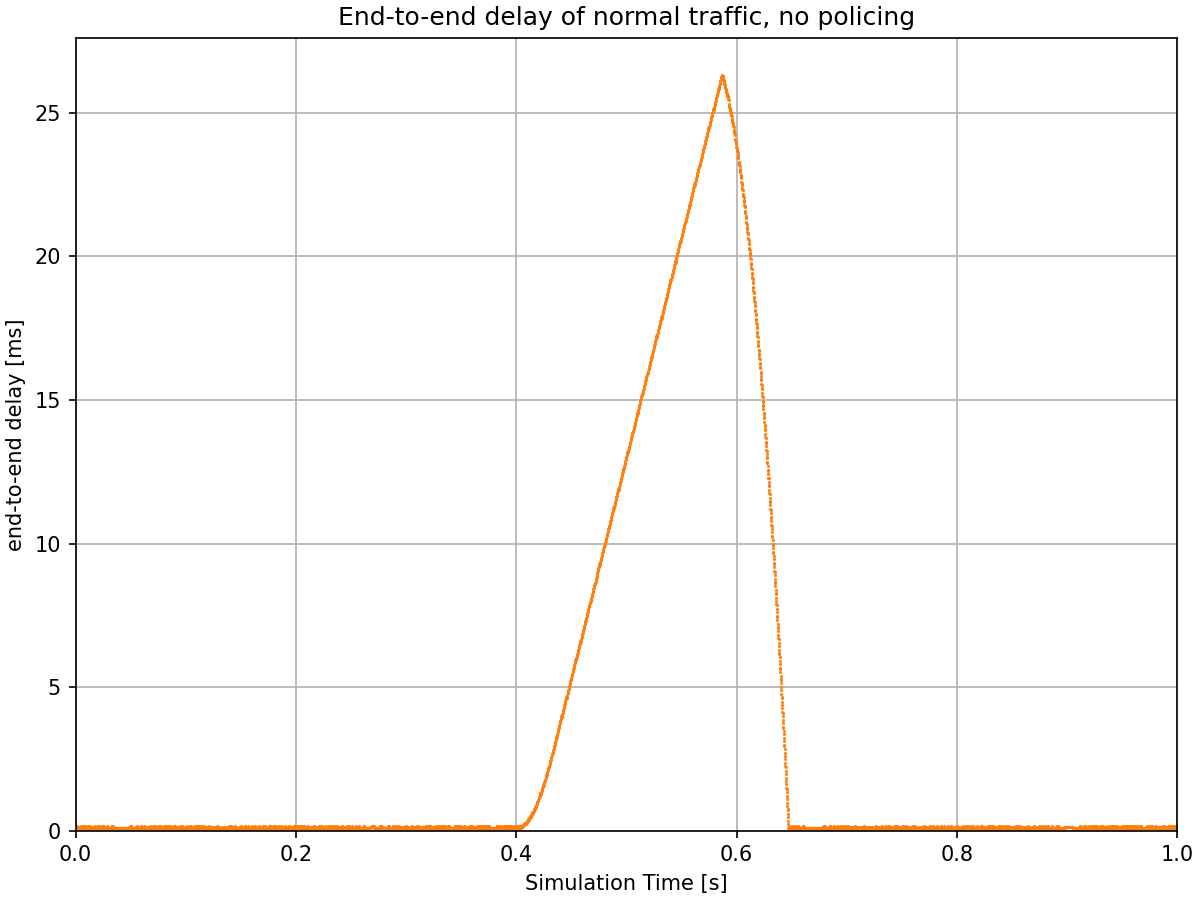
Without policing, the normal traffic suffers a significant delay spike reaching up to ~25 ms during the period when the misbehaving traffic is high. This clearly demonstrates the problem: well-behaved traffic is disrupted by misbehaving or excessive traffic sources sharing the same network infrastructure.
With Policing
The following chart compares traffic at the server with and without policing, showing how token bucket policing solves this problem:
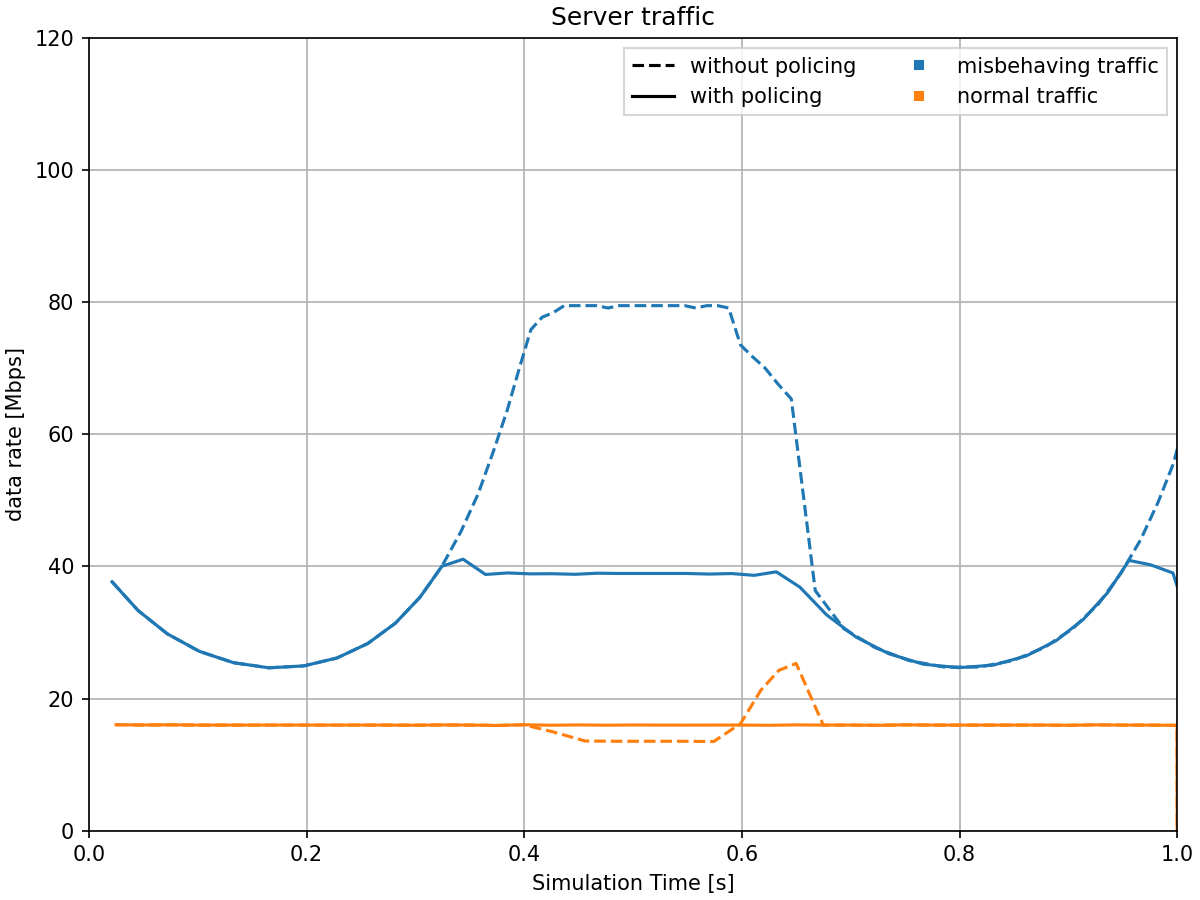
With token bucket policing enabled in the switch’s ingress filter, the misbehaving traffic is now limited to approximately its configured committed information rate of 40 Mbps – the peaks that previously exceeded the limit are clipped by the token bucket mechanism. The normal traffic continues to flow at its expected rate of 20 Mbps, unaffected by the excess traffic. The total traffic to the server stays well within the link capacity.
The next chart shows the end-to-end delay of normal traffic, with and without policing:
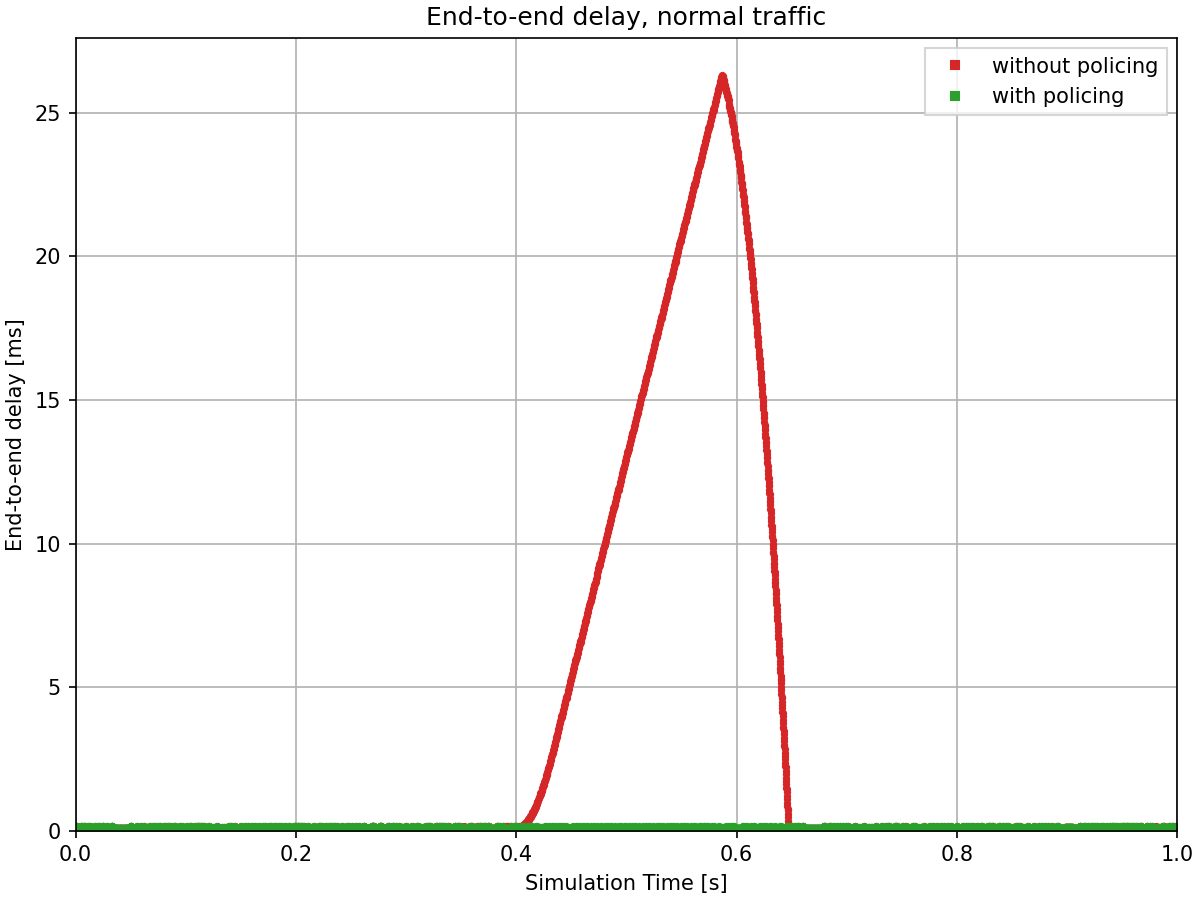
With policing enabled, the normal traffic experiences consistently low delays, typically under 1 ms, with no significant spikes. The token bucket mechanism has successfully protected the normal traffic from being disrupted by the misbehaving traffic stream. This demonstrates a key benefit of per-stream policing in TSN environments: ensuring predictable performance for well-behaved streams.
Additional Details
The remaining charts provide insight into how the token bucket mechanism operates internally. Here are the incoming, outgoing, and dropped data rates in the misbehaving traffic’s filter:
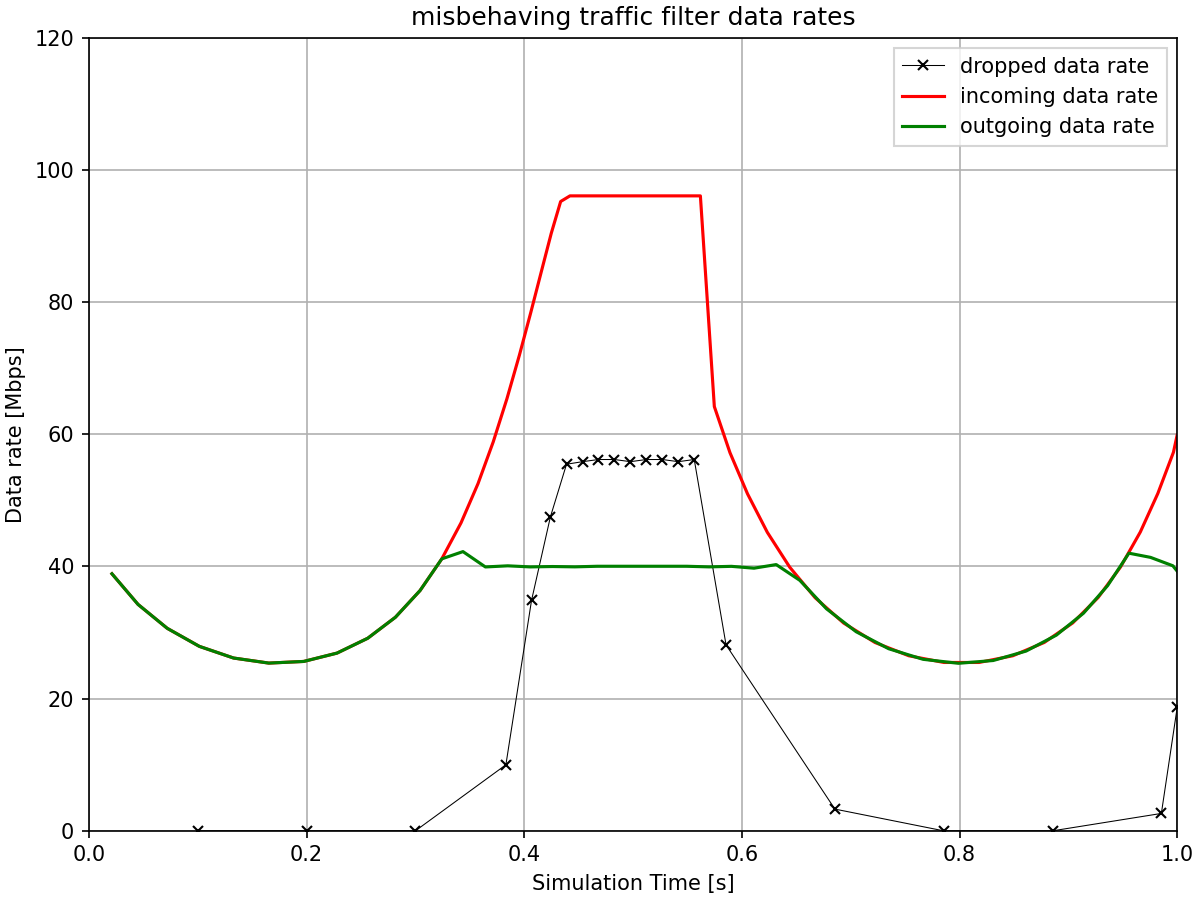
The misbehaving traffic filter shows substantial packet drops when the incoming traffic rate exceeds what the token bucket can accommodate. During traffic bursts, packets are dropped when tokens are insufficient. The green solid line shows the packets that passed through – these correspond to periods when the token bucket had sufficient tokens. The committed burst size of 10 kB allows some short-term bursts to pass, but sustained excess traffic is dropped to enforce the 40 Mbps committed information rate. Now let’s see the same for the normal traffic’s filter:
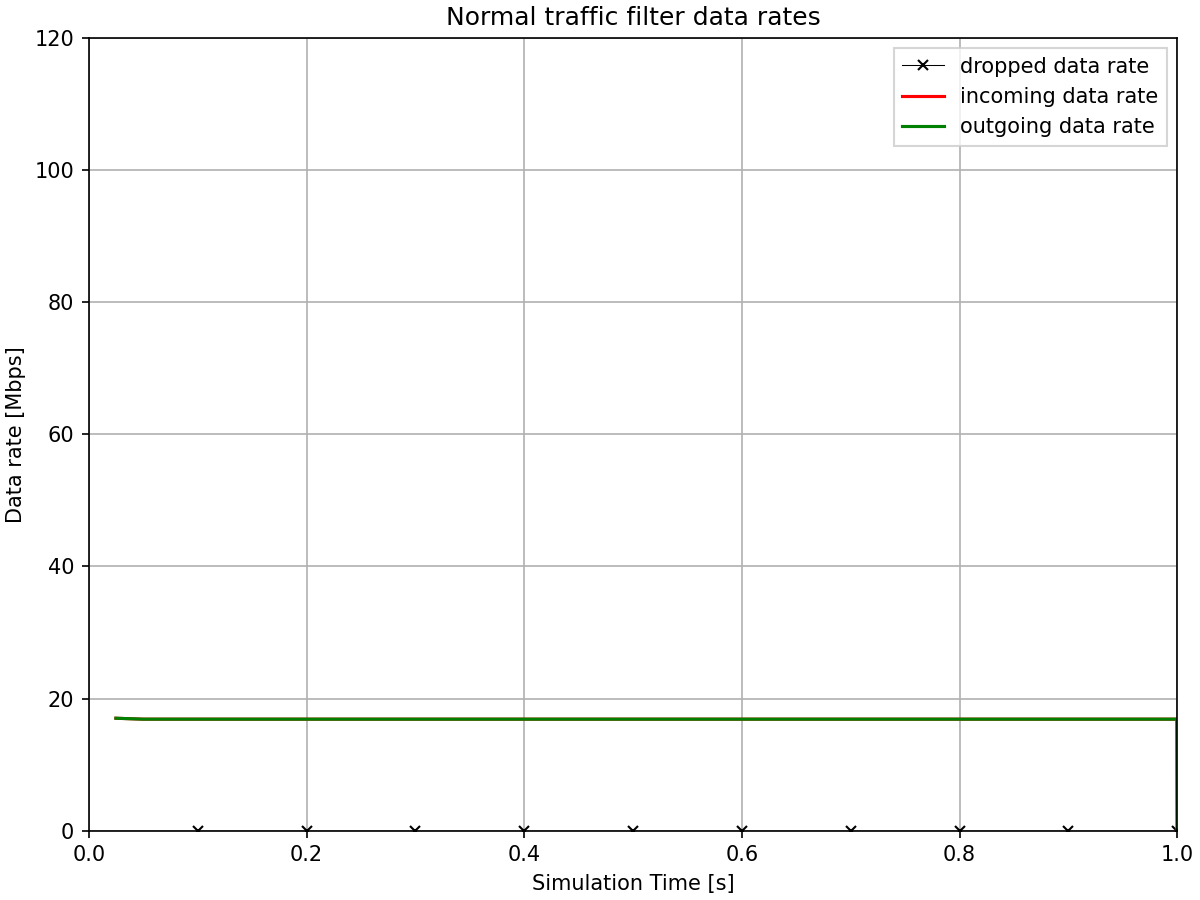
The normal traffic filter shows that virtually all packets pass through with no drops. Since the normal traffic operates well within its configured limit (20 Mbps committed information rate with 5 kB committed burst size), the token bucket always has sufficient tokens available.
The next chart shows the number of tokens available in each bucket over time.
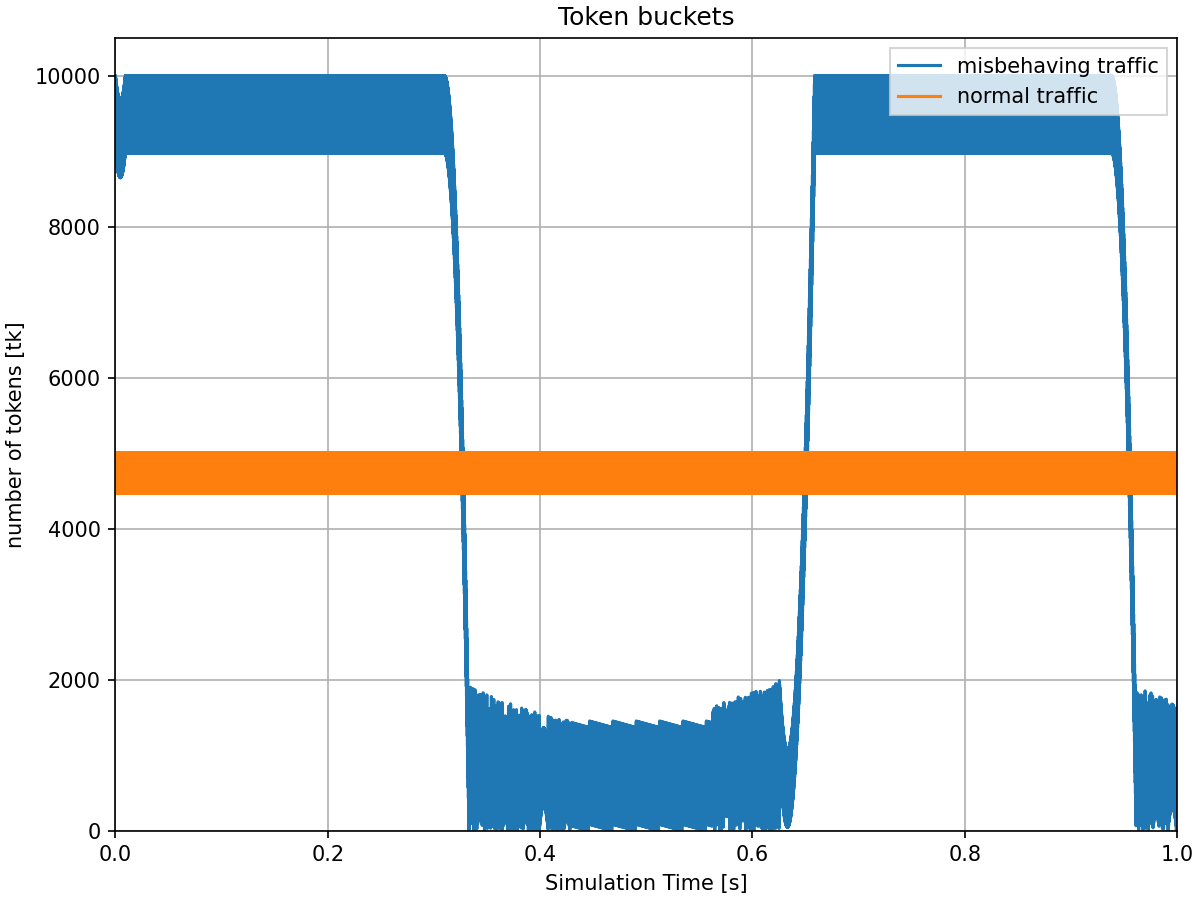
The misbehaving traffic bucket (blue line) shows significant variation, frequently dropping to low levels during traffic bursts when packets consume tokens faster than the committed information rate replenishes them. When the token count is low or zero, incoming packets are labeled red and subsequently dropped by the filter.
The normal traffic bucket (orange line) maintains a relatively higher token count throughout the simulation. Since the normal traffic rate is well below its configured committed information rate, tokens accumulate to the committed burst size limit during quiet periods and are available during traffic bursts. This explains why the normal traffic filter showed no packet drops.
The maximum token count for each bucket corresponds to its committed burst size: 10 kB (10,000 Bytes) for misbehaving traffic and 5 kB (5,000 Bytes) for normal traffic.
Sources: omnetpp.ini
Try It Yourself
If you already have INET and OMNeT++ installed, start the IDE by typing
omnetpp, import the INET project into the IDE, then navigate to the
inet/showcases/tsn/streamfiltering/tokenbucket folder in the Project Explorer. There, you can view
and edit the showcase files, run simulations, and analyze results.
Otherwise, there is an easy way to install INET and OMNeT++ using opp_env, and run the simulation interactively.
Ensure that opp_env is installed on your system, then execute:
$ opp_env run inet-4.6 --init -w inet-workspace --install --build-modes=release --chdir \
   -c 'cd inet-4.6.*/showcases/tsn/streamfiltering/tokenbucket && inet'
This command creates an inet-workspace directory, installs the appropriate
versions of INET and OMNeT++ within it, and launches the inet command in the
showcase directory for interactive simulation.
Alternatively, for a more hands-on experience, you can first set up the workspace and then open an interactive shell:
$ opp_env install --init -w inet-workspace --build-modes=release inet-4.6
$ cd inet-workspace
$ opp_env shell
Inside the shell, start the IDE by typing omnetpp, import the INET project,
then start exploring.
Discussion
Use this page in the GitHub issue tracker for commenting on this showcase.