Packet Loss vs. Distance Using Various WiFi Bitrates
Goals
In this showcase, we perform a parameter study where we examine how the packet error rate changes as a function of distance in an 802.11g wireless network. The packet error rate is measured at various WiFi bitrates, providing insights into the impact of different bitrates on the quality of communication over different distances.
4.6The Model
The network contains two hosts operating in 802.11g ad-hoc mode at 10 mW transmission power. One of the hosts acts as a traffic source, the other as a traffic sink. We will perform a parameter study with the distance and the bitrate as parameters. The distance will run between 10 and 550 meters, in 2-meter steps. The bitrate will take the ERP modes in 802.11g: 6, 9, 12, 18, 24, 36, 48, and 54 Mbps. This results in about 2100 simulation runs.
To make the model more realistic, we will simulate multipath propagation
using the TwoRayGroundReflection path loss model. (There are various
path loss models in INET, including FreeSpacePathLoss,
RayleighFading, RicianFading, LogNormalShadowing, and
NakagamiFading). The two-ray ground reflection path loss model
requires a ground model, which is configured in the
physicalEnvironment module to be FlatGround. The heights of the
hosts above the ground are set to 1.5 meters. We assume isotropic
background noise of -86 dBm (IsotropicScalarBackgroundNoise).
We will use the Ieee80211NistErrorModel to compute bit errors. The Ieee80211NistErrorModel is based on the Nist error rate model.
In each simulation run, the source host will send a single UDP packet (56 bytes of UDP data, resulting in a 120-byte frame) to the destination host as a probe. At packet reception, the error model will compute the bit error rate (BER) from the signal-to-noise-plus-interference-ratio (SNIR). The packet error rate (PER) will be computed from the BER. The simulation records SNIR, BER, and PER. Note that in this simulation model, the physical layer simulation is entirely deterministic, hence there is no need for Monte Carlo.
We lower the snirThreshold parameter of the hosts’ radios from 4 to
0 dB. When the transmission’s SNIR is below this value, the reception is
assumed to be incorrect, and the reception is not simulated. Lowering
the level results in more fine-grained data at low SNIR levels.
Results
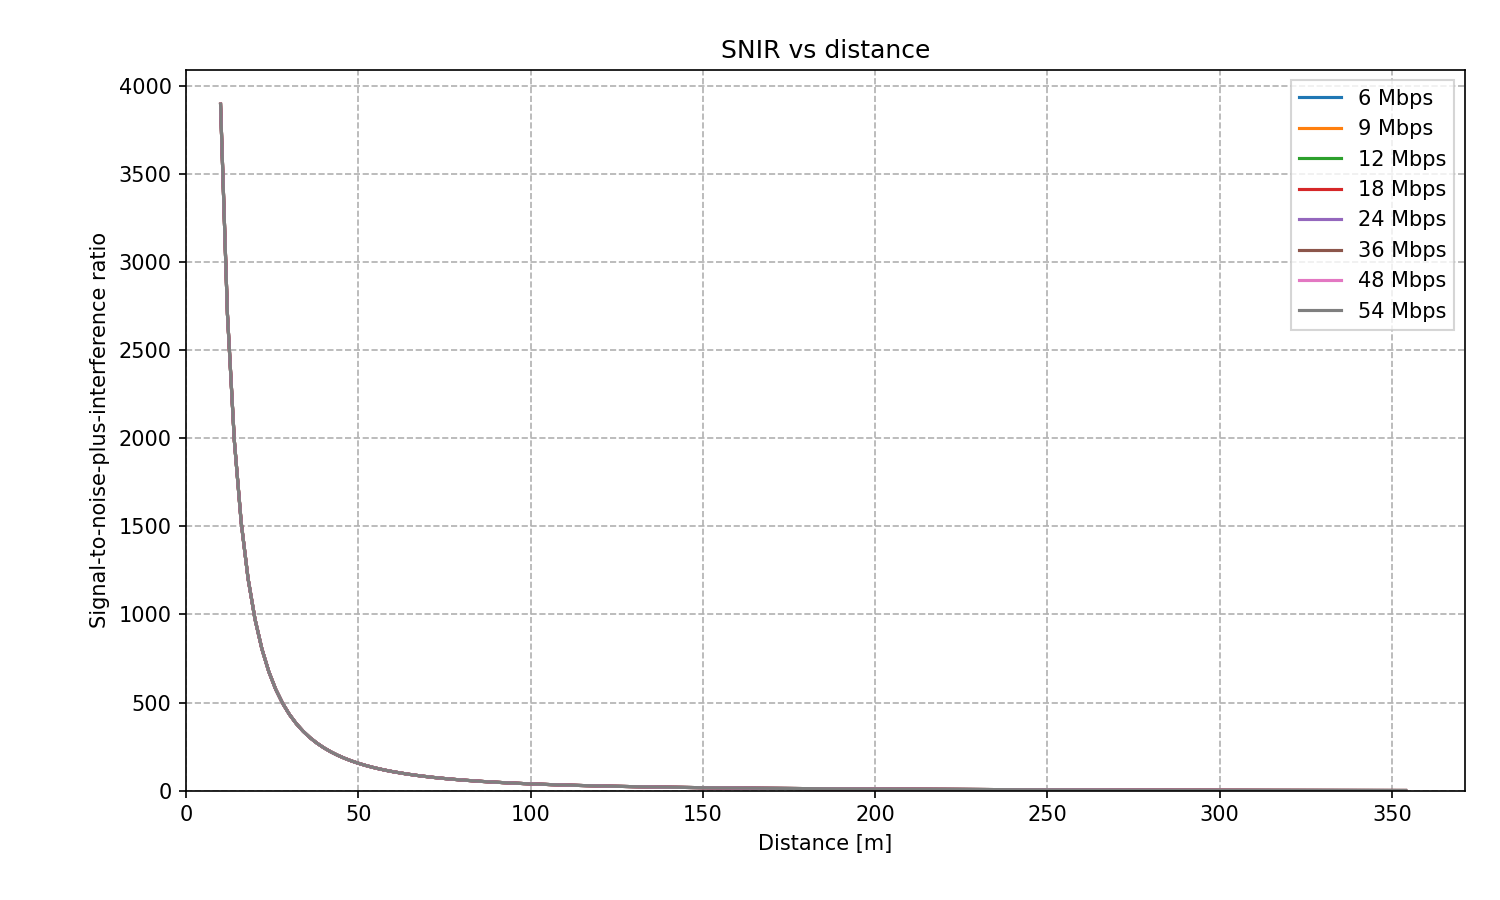
SNIR, BER, and PER are recorded from the simulation runs. SNIR is measured at the receiver and depends on the power of the noise and the power of the signal. The signal power decreases with distance, so the SNIR does as well. SNIR is independent of modulations and coding schemes, so it is the same for all bitrates. This can be seen in the following plot, which displays SNIR against distance.
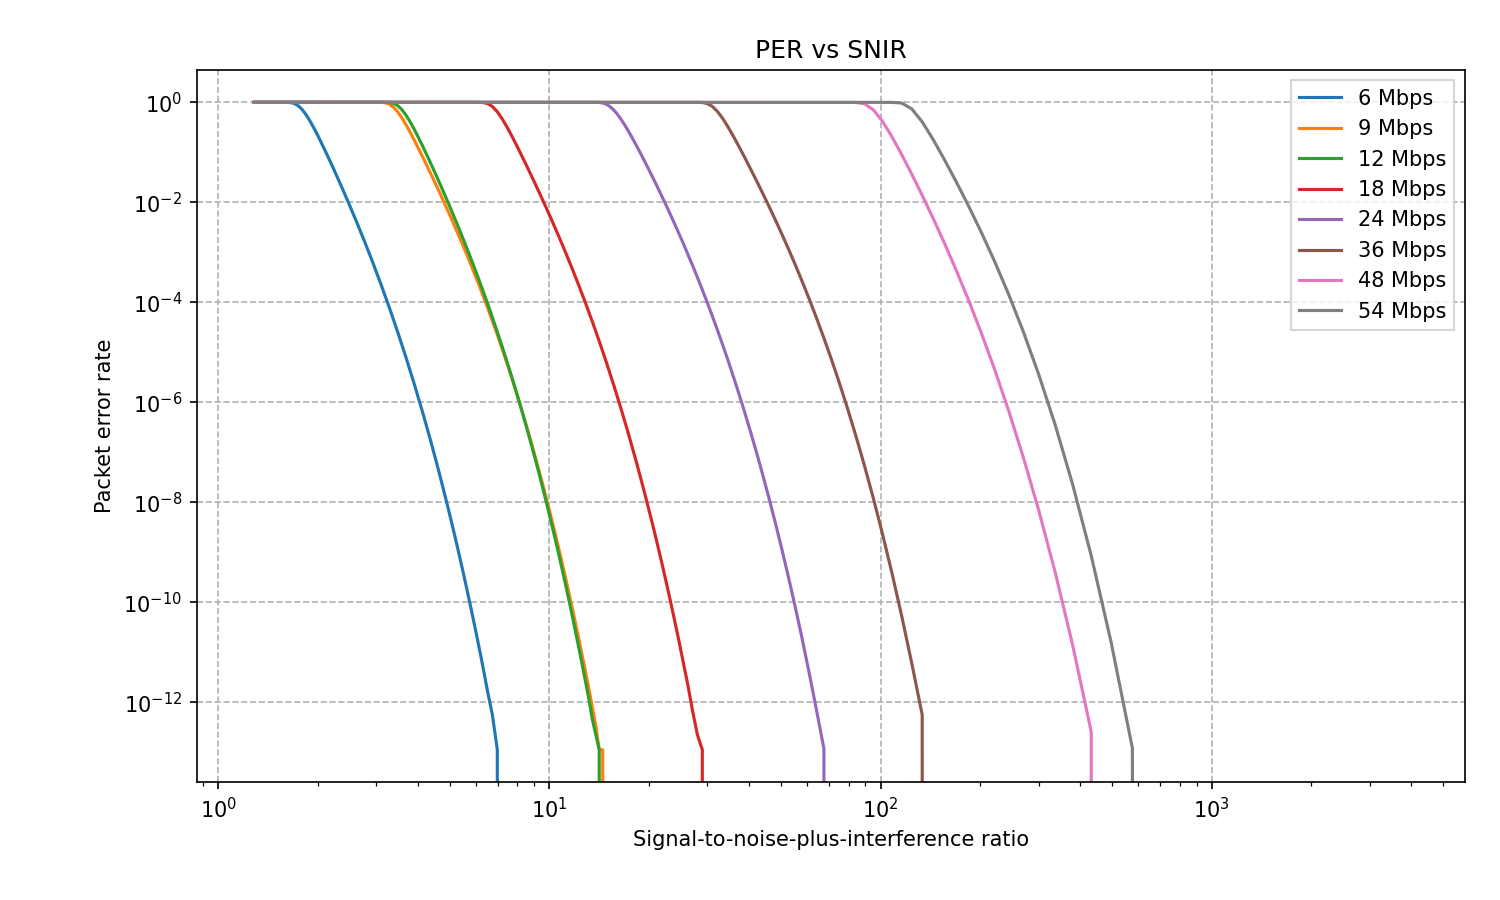
The next plot shows how the packet error rate decreases with SNIR. Slower bitrates use simpler modulation like binary phase shift keying, which is more tolerant to noise than more complex modulations used by faster bitrates. Hence, there is a difference in the graph between the different bitrates.
The various modulations and coding rates of 802.11g ERP modes are the following:
6 and 9 Mbit/s modes use BPSK, coding rates 1/2 and 3/4
12 and 18 Mbit/s modes use QPSK, coding rates 1/2 and 3/4
24 and 36 Mbit/s modes use 16-QAM, coding rates 1/2 and 3/4
48 and 54 Mbit/s modes use 64-QAM, coding rates 1/2 and 3/4
Note that the completely flat and completely vertical lines on the plot are due to the signal power decreasing below the sensitivity of the receiver.
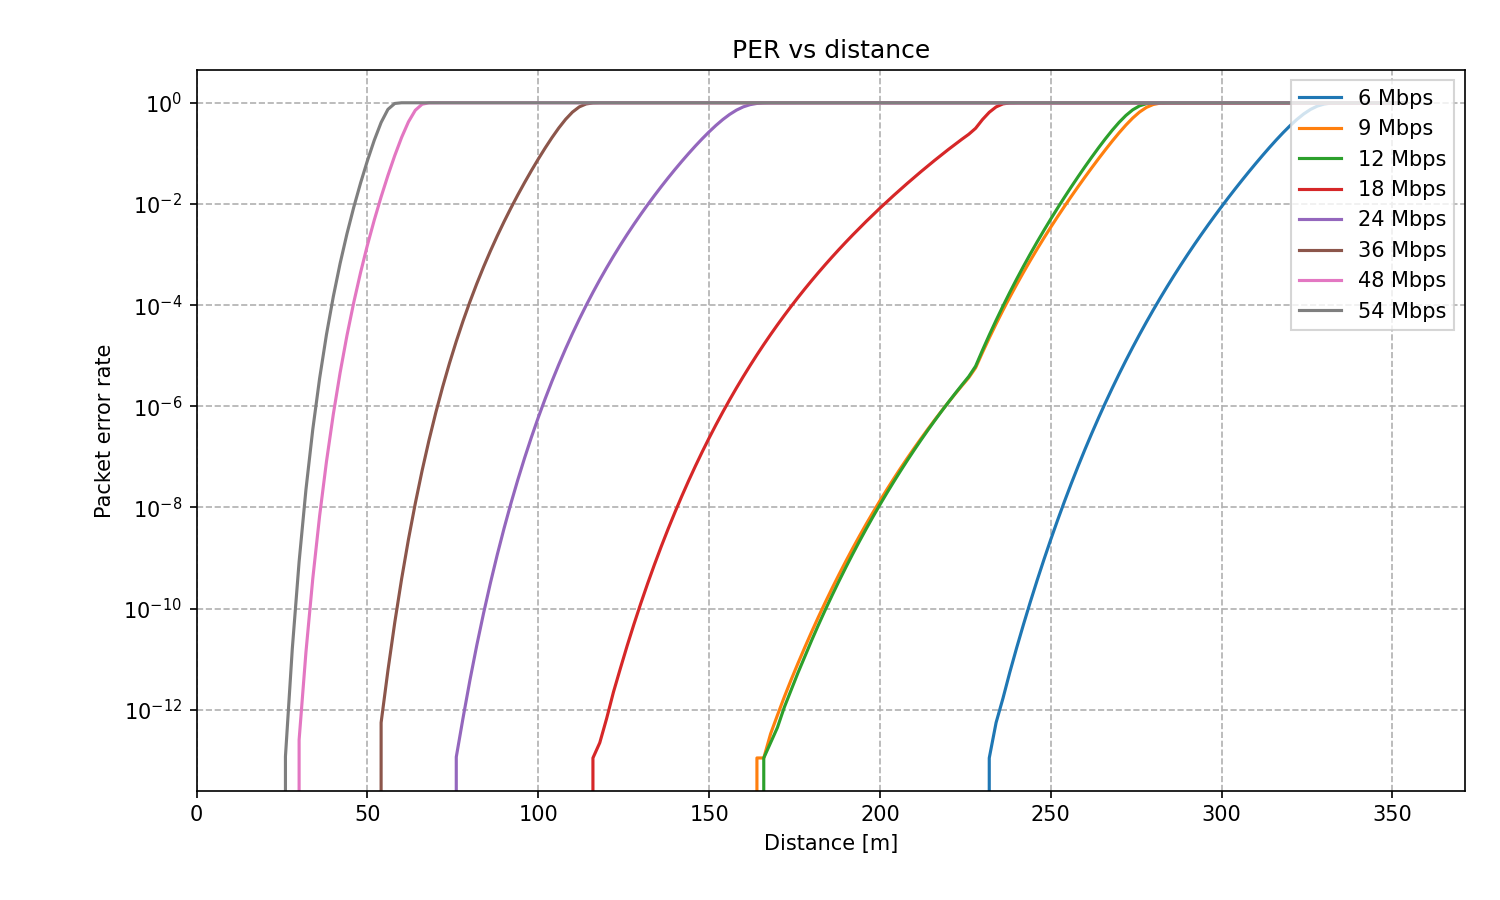
The following plot shows the packet error rate vs. distance. Again, slower bitrates show fewer packet errors as the distance increases because of the simpler modulation.
We also compute the effective bitrate, which is the gross bitrate decreased by packet errors. It is computed with the following formula:
effective bitrate = (1 - PER) * nominal bitrate
It is equal to the nominal data bitrate unless it is decreased because of bit errors as the distance increases.
Effective bitrate vs. distance is shown on the next plot. Higher bitrates are more sensitive to increases in distance, as the effective bitrate drops rapidly after a critical distance. This critical distance is farther for slower bitrates, and the decrease is not as rapid.
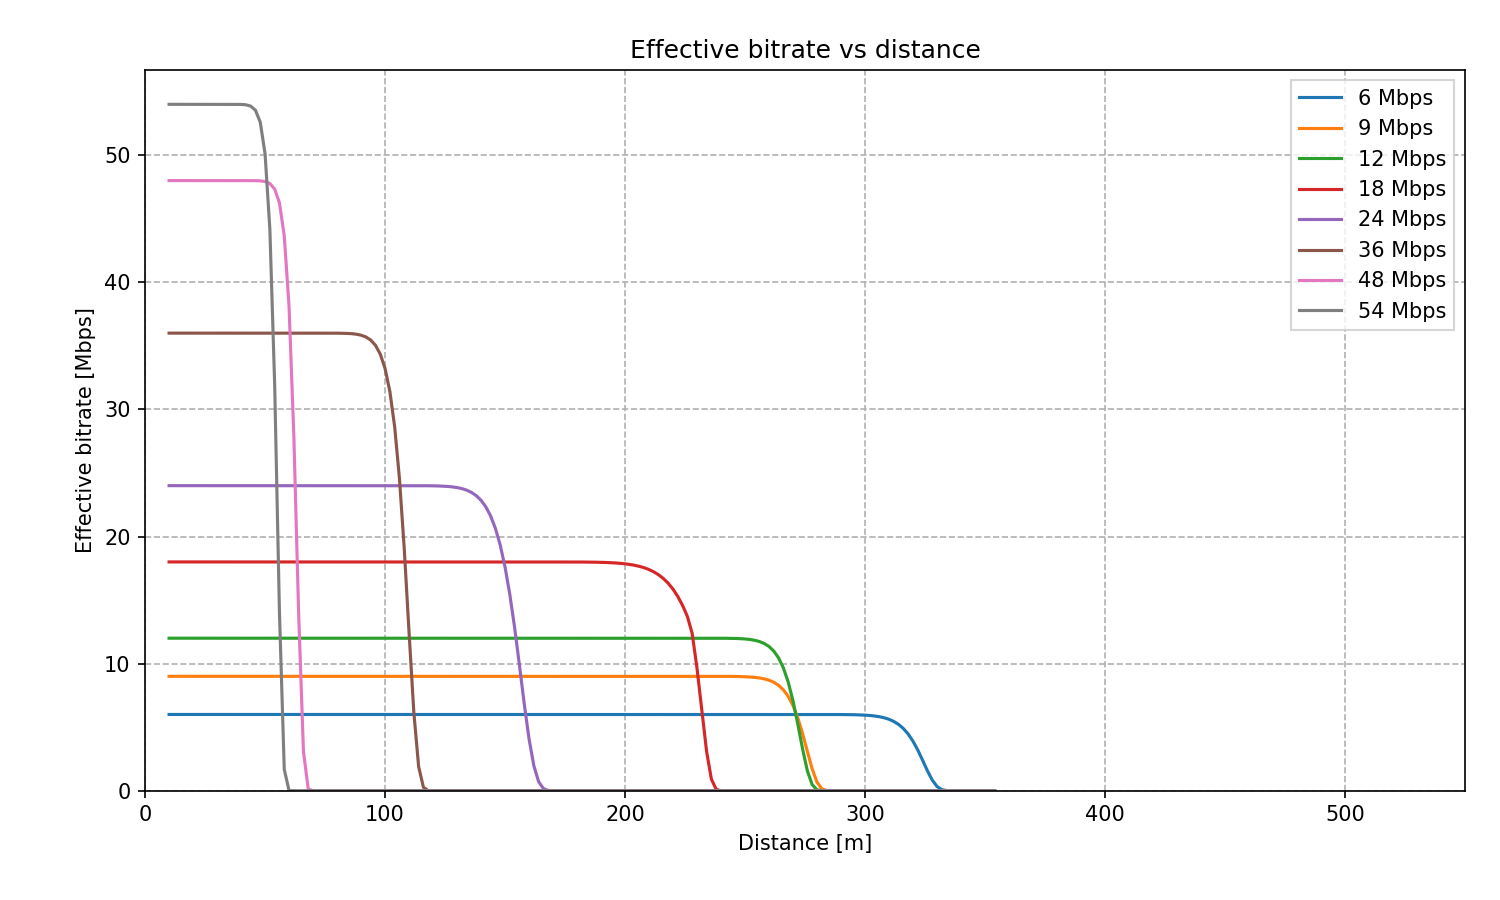
802.11 ranges depend on many variables, e.g., transmission power, receiver sensitivity, antenna gains and directionality, and background noise levels. The above ranges correspond to arbitrary values for the variables. In reality, ranges can vary significantly.
Conclusion
The packet error rate increases quickly as the distance approaches the critical point. Slower bitrates are less sensitive to increasing distance because they use simpler modulation. Faster bitrate modes are advantageous in short distances because of the increased throughput, but slower modes work better at longer distances. Furthermore, using rate adaptation, a host can use fast modes for short distances and slower modes for larger ones. When the number of lost packets increases and throughput drops, it becomes more viable to change to a slower bitrate mode. For example, the rate control algorithm could change to the slower bitrate at around the critical point, about where the curves for two adjacent bitrate modes intersect.
Sources: omnetpp.ini, ErrorRateShowcase.ned
Try It Yourself
If you already have INET and OMNeT++ installed, start the IDE by typing
omnetpp, import the INET project into the IDE, then navigate to the
inet/showcases/wireless/errorrate folder in the Project Explorer. There, you can view
and edit the showcase files, run simulations, and analyze results.
Otherwise, there is an easy way to install INET and OMNeT++ using opp_env, and run the simulation interactively.
Ensure that opp_env is installed on your system, then execute:
$ opp_env run inet-4.6 --init -w inet-workspace --install --build-modes=release --chdir \
   -c 'cd inet-4.6.*/showcases/wireless/errorrate && inet'
This command creates an inet-workspace directory, installs the appropriate
versions of INET and OMNeT++ within it, and launches the inet command in the
showcase directory for interactive simulation.
Alternatively, for a more hands-on experience, you can first set up the workspace and then open an interactive shell:
$ opp_env install --init -w inet-workspace --build-modes=release inet-4.6
$ cd inet-workspace
$ opp_env shell
Inside the shell, start the IDE by typing omnetpp, import the INET project,
then start exploring.
Discussion
Use this page in the GitHub issue tracker for commenting on this showcase.