Visualizing Packet Drops
Goals
This showcase presents various simulation models that demonstrate the use of the packet drop visualizer in identifying network problems in INET simulations. The visualizer helps to pinpoint the causes of excessive packet drops, such as poor connectivity, congestion, or misconfiguration, allowing for more efficient debugging and analysis. The simulation models showcase typical scenarios of packet drops resulting from issues such as retransmission in wireless networks and overflowing queues in bottleneck routers.
4.6About the visualizer
Packet drops can be visualized by including a PacketDropVisualizer module in the simulation. The PacketDropVisualizer module indicates packet drops by displaying an animation effect at the node where the packet drop occurs. In the animation, a packet icon gets thrown out from the node icon and fades away.
The visualization of packet drops can be enabled with the visualizer’s
displayPacketDrops parameter. By default, all packet drops at all nodes
are visualized. This selection can be narrowed with the nodeFilter,
interfaceFilter, and packetFilter parameters, which match for node, interface, and packet.
(The packetFilter can filter for packet properties, such as name, fields, chunks, protocol headers, etc.)
Additionally, use the detailsFilter parameter to filter for packet drop reasons.
The labelFormat parameter is a format string and specifies the text displayed with the packet drop animation.
By default, the dropped packet’s name is displayed.
The format string can contain the following directives:
%n: packet name
%c: packet class
%r: drop reason number
%s: drop reason string
Here are some reasons for which packets can be dropped:
queue overflow
retry limit exceeded
unroutable packet
network address resolution failed
interface down
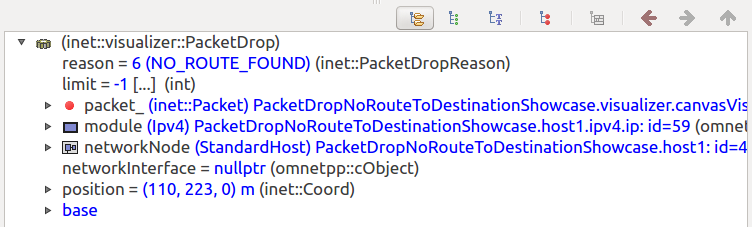
One can click on the packet drop icon to display information about the packet drop in the inspector panel, such as the packet drop reason or the module where the packet was dropped:
The following sections demonstrate some reasons for dropped packets with example simulations. In the simulations, the PacketDropVisualizer is configured to indicate the packet name and the drop reason.
Queue overflow
In this section, we present an example demonstrating packet drops due
to queue overflow. This simulation can be run by choosing the
QueueFull configuration from the ini file. The network contains a
bottleneck link where packets will be dropped due to an overflowing
queue:
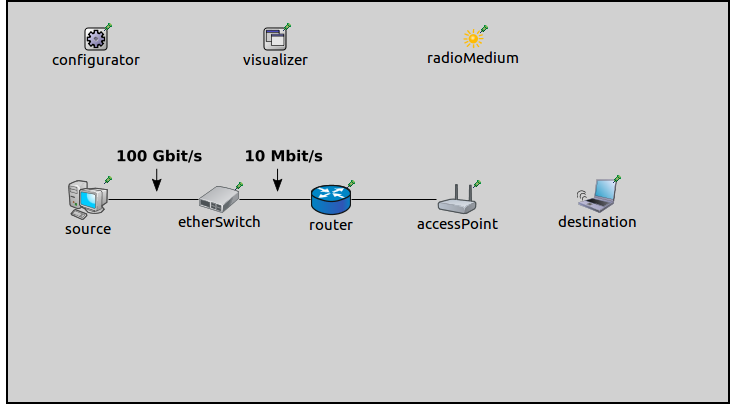
It contains a StandardHost named source, an EthernetSwitch, a
Router, an AccessPoint, and a WirelessHost named
destination. The source is configured to send a stream of UDP
packets to destination. The packet stream starts at two seconds
after destination got associated with the access point. The
source is connected to the etherSwitch via a high-speed, 100
Gbit/s ethernet cable, while the etherSwitch and the router are
connected with a low-speed, 10 Mbit/s cable. This low-speed cable creates a bottleneck
in the network, between the switch and the router. The source host is
configured to generate more UDP traffic than the 10Mbit/s channel can
carry. The cause of packet drops in this case is that the queue in
etherSwitch fills up.
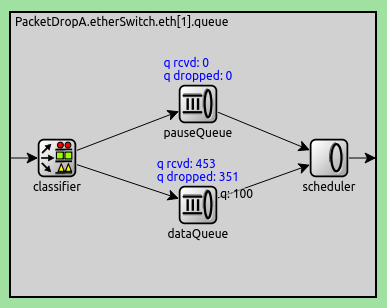
The queue types in the switch’s Ethernet interfaces are set to DropTailQueue, with a default length of 100 packets (by default, the queues have infinite lengths). The packets are dropped at the ethernet queue of the switch.
The visualization is activated with the displayPacketDrops
parameter. The visualizer is configured to display the packet name
and the drop reason by setting the labelFormat parameter.
Also, the fade-out time is set to three seconds, so that the packet
drop animation is more visible.
*.visualizer.packetDropVisualizer.displayPacketDrops = true
*.visualizer.packetDropVisualizer.labelFormat = "%n/reason: %r"
*.visualizer.packetDropVisualizer.fadeOutTime = 3s
When the simulation is run, the UDP stream starts at around two seconds, and packets start accumulating in the queue of the switch. When the queue fills up, the switch starts dropping packets. This scenario is illustrated in this animation:
Here is the queue in the switch’s eth1 interface, showing the number of packet drops:
This log excerpt shows the packet drop:

ARP resolution failed
In this example, a host tries to ping a non-existent destination. The
configuration for this example is ArpResolutionFailed in the ini
file. Packets will be dropped because the MAC address of the destination
cannot be resolved. The network for this configuration is the following:
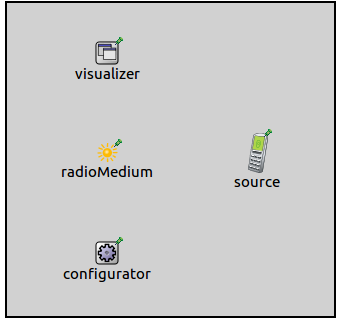
It contains only one host, an AdhocHost.
The host is configured to ping the IP address 10.0.0.2. It will try to resolve the destination’s MAC address with ARP. Since there are no other hosts, the ARP resolution will fail, and the ping packets will be dropped.
The following animation illustrates this:
This excerpt shows this in the log:

MAC retry limit reached
In this example, packet drops occur due to two wireless hosts trying to
communicate while out of communication range. The simulation can be run
by selecting the MACRetryLimitReached configuration from the ini
file. The configuration uses the following network:
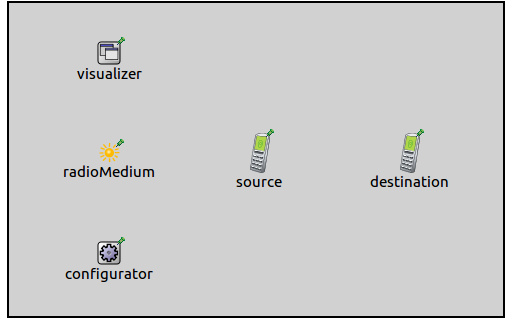
It contains two AdhocHost’s named source and destination.
The hosts’ communication ranges are set up, so they are out of range of
each other. The source host is configured to ping the destination host.
The reason for packet drops in this case is that the hosts are not in
range, so they can’t reach each other. The source transmits the
ping packets, but it doesn’t receive any ACK in reply. The source's
MAC module drops the packets after the retry limit has been reached.
This scenario is illustrated in the following animation:
These events look like the following in the logs:

No route to destination
In this example, packets will be dropped due to the lack of static
routes. The configuration is NoRouteToDestination in the ini file.
The network is the following:
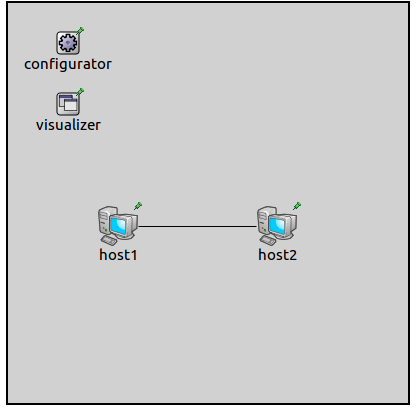
It contains two connected StandardHost’s. The
Ipv4NetworkConfigurator is instructed not to add any static routes,
and host1 is configured to ping host2.
The ping packets can’t be routed, so the IP module drops them. This scenario is illustrated in the following video:
Here is also a log excerpt illustrating this:

Interface not connected
In this example (InterfaceNotConnected configuration in the ini
file), packet drops occur due to a disabled wired connection between the
hosts:
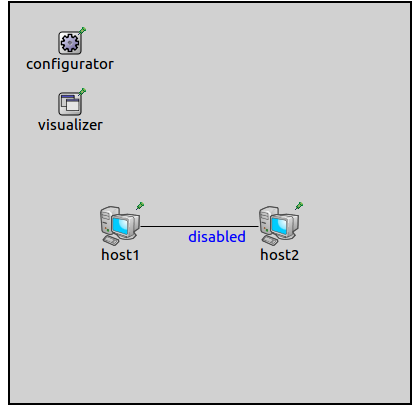
It contains two StandardHost’s, connected with an ethernet cable. The
ethernet cable is configured in the NED file to be disabled.
Additionally, host1 is configured to ping host2.
Since the cable between the hosts is configured to be disabled, the MAC module is unable to send the packets and drops them. This is illustrated in the following animation:
Note the packet drop animation at host1. The packet drops are also
evidenced in the log:

Further information
For more information, refer to the PacketDropVisualizer NED documentation.
Try It Yourself
If you already have INET and OMNeT++ installed, start the IDE by typing
omnetpp, import the INET project into the IDE, then navigate to the
inet/showcases/visualizer/canvas/packetdrop folder in the Project Explorer. There, you can view
and edit the showcase files, run simulations, and analyze results.
Otherwise, there is an easy way to install INET and OMNeT++ using opp_env, and run the simulation interactively.
Ensure that opp_env is installed on your system, then execute:
$ opp_env run inet-4.6 --init -w inet-workspace --install --build-modes=release --chdir \
   -c 'cd inet-4.6.*/showcases/visualizer/canvas/packetdrop && inet'
This command creates an inet-workspace directory, installs the appropriate
versions of INET and OMNeT++ within it, and launches the inet command in the
showcase directory for interactive simulation.
Alternatively, for a more hands-on experience, you can first set up the workspace and then open an interactive shell:
$ opp_env install --init -w inet-workspace --build-modes=release inet-4.6
$ cd inet-workspace
$ opp_env shell
Inside the shell, start the IDE by typing omnetpp, import the INET project,
then start exploring.
Discussion
Use this page in the GitHub issue tracker for commenting on this showcase.