Visualizing Statistics
Goals
Although statistical data collected during a simulation is typically analyzed after the simulation has completed, monitoring statistical data while the simulation is running can also provide valuable insights into the behavior of the model. For example, in a video streaming network, observing the throughput of each client can immediately indicate if the model is performing as expected.
To aid in real-time monitoring, INET supports the visualization of statistics collected by arbitrary submodules of network nodes, and displayed near the icons representing the network nodes. This visualization can assist in troubleshooting and early detection of potential problems in simulation models. The showcase features two example simulations, demonstrating both basic and advanced features of the visualization.
4.6About the visualizer
The StatisticCanvasVisualizer (included in the network as part of IntegratedCanvasVisualizer) is capable of displaying a statistic for multiple network nodes. The visualizer keeps track of the last values of statistics and displays them next to the icon of the network node.
It subscribes for the signal selected with the signalName parameter
and displays the statistic selected with the statisticName
parameter. It displays the statistic of modules that match the
expression of the sourceFilter parameter, at the network node that
contains the modules. By default, the statisticName is the same as
the signalName. The unit parameter can be used to specify the
unit (or units) to display the statistic in; by default, it is the statistic’s unit.
Alternatively, the statisticExpression parameter can be used instead of statisticName.
The statisticExpression parameter can specify an expression with OMNeT++’s @statistic syntax.
This is useful in case there is no statistic for the required data, or for selecting another statistic recording mode (by default, the first recording mode defined in the statistic is used by statisticName).
The format parameter is a string that specifies how the visualizer
displays the statistic value. The format string can contain the
following directives:
%s: signal name%n: name of statistic%v: value of statistic%u: unit of statistic
The default setting for the format string is "%n %v %u", i.e. it
displays the statistic name, followed by the value and the unit. The
unit parameter selects what unit to display the value in. By
default, it is the unit of the statistic.
Displaying round trip time of ping packets
In the first example simulation, a wireless node will ping another
wireless node. We will display the round trip time of ping packets above
source node. The simulation can be run by choosing the PingRtt
configuration from the ini file. The simulation uses the following
simple network:
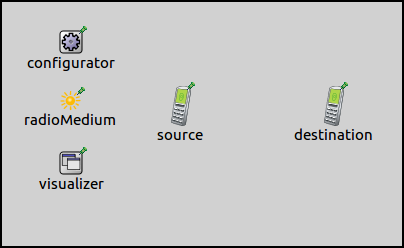
The network contains two AdhocHost’s. The hosts are stationary, and
source is configured to ping destination.
The configuration of the visualization in omnetpp.ini is the following:
*.visualizer.statisticVisualizer.sourceFilter = "**.app[*]"
*.visualizer.statisticVisualizer.signalName = "rtt"
*.visualizer.statisticVisualizer.unit = "ms"
The signal name is set to rtt, and since there is no statistic name
specified, it is also the statistic name. The unit of the statistic is
seconds, but the visualizer is set to display the value in milliseconds.
The sourceFilter is not strictly required for this configuration to
work, because the signalName parameter is fully specific. The
rtt signal is only emitted by pingApp modules, so the default
value of sourceFilter, which matches all modules, would suffice. The
statistic is only displayed above source, because destination’s
ping application doesn’t send any ping packets, thus there is no round
trip time statistic to display.
Displaying packet error rate
In the second example simulation, a wireless node will send UDP packets
to another wireless node as the distance between them increases. We will
display the packet error rate statistic of the received packet at the
receiving node. The simulation can be run by choosing
PacketErrorRate from the ini file. The simulation uses the following
network:
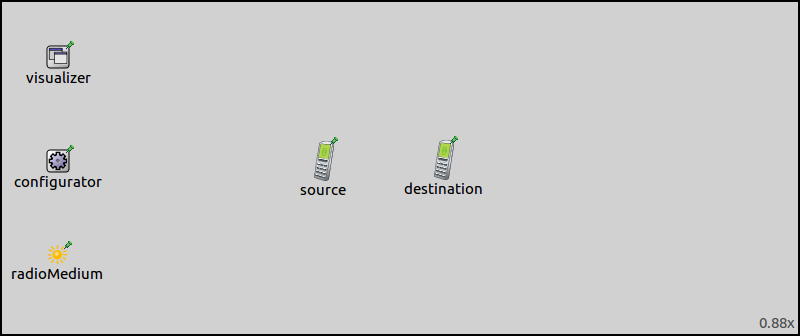
The network contains two AdhocHost’s. One of them, the source, is
stationary, while the destination is configured to move horizontally
back and forth between its starting position and the right border of the
playground. The source is configured to send UDP packets to
destination.
The visualizer is configured to display the packet error rate statistic
of destination host’s radio module:
*.visualizer.statisticVisualizer.signalName = "packetSentToUpper"
*.visualizer.statisticVisualizer.statisticExpression = "packetErrorRate"
*.visualizer.statisticVisualizer.sourceFilter = "*.destination.wlan[*].radio"
*.visualizer.statisticVisualizer.format = "packetErrorRate: %v"
This animation illustrates what happens when the simulation is run:
After the first packet exchange, the packet error rate statistic is
displayed above destination. As the simulation progresses,
destination starts moving away from source, while source is
sending UDP packets to destination. Initially, destination’s
packet error rate statistic is zero, because the hosts are close to each
other, and the transmissions are received correctly. As their distance
increases, the packet error rate begins to grow. It becomes one near the
edge of source’s communication range (displayed as a blue circle). A
packet error rate of one means that no packets are received correctly.
The packet error rate doesn’t become one at exactly the communication
range circle, because the circle is an estimation of source’s
communication range. When destination turns back and gets into the
range again, the packet error rate starts to decrease, reaching zero
when it gets close to source.
Further information
For further information, refer to the StatisticVisualizer NED documentation.
Try It Yourself
If you already have INET and OMNeT++ installed, start the IDE by typing
omnetpp, import the INET project into the IDE, then navigate to the
inet/showcases/visualizer/canvas/statistic folder in the Project Explorer. There, you can view
and edit the showcase files, run simulations, and analyze results.
Otherwise, there is an easy way to install INET and OMNeT++ using opp_env, and run the simulation interactively.
Ensure that opp_env is installed on your system, then execute:
$ opp_env run inet-4.6 --init -w inet-workspace --install --build-modes=release --chdir \
   -c 'cd inet-4.6.*/showcases/visualizer/canvas/statistic && inet'
This command creates an inet-workspace directory, installs the appropriate
versions of INET and OMNeT++ within it, and launches the inet command in the
showcase directory for interactive simulation.
Alternatively, for a more hands-on experience, you can first set up the workspace and then open an interactive shell:
$ opp_env install --init -w inet-workspace --build-modes=release inet-4.6
$ cd inet-workspace
$ opp_env shell
Inside the shell, start the IDE by typing omnetpp, import the INET project,
then start exploring.
Discussion
Use this page in the GitHub issue tracker for commenting on this showcase.