Visualizing IEEE 802.11 Network Membership
Goals
When simulating wireless networks that overlap in space or where network membership changes over time, getting an overview of the membership of each node can be cumbersome. In such simulations, the IEEE 802.11 network membership visualizer can be very helpful.
In this showcase, we demonstrate how to display the SSID of each node, making it easier to understand the network membership and how it changes over time.
4.6About the visualizer
In INET, IEEE 802.11 network membership can be visualized by including a
Ieee80211Visualizer module in the simulation. Adding an
IntegratedCanvasVisualizer is also an option because it also contains a
Ieee80211CanvasVisualizer. Displaying network membership is disabled by
default; it can be enabled by setting the visualizer’s
displayAssociations parameter to true.
The Ieee80211CanvasVisualizer displays an icon and the SSID above network nodes which are part of a wifi network. The icons are color-coded according to the SSID. The icon, colors, and other visual properties can be configured via parameters of the visualizer.
The visualizer’s nodeFilter parameter selects which nodes’
memberships are visualized. The interfaceFilter parameter selects
which interfaces are considered in the visualization. By default, all
interfaces of all nodes are considered.
Furthermore, the visualization takes the signal strength of the various Wifi networks into account,
indicating it with the number of levels in the Wifi icon. The visualizer’s minPower and maxPower
parameters control the range of indicated power levels.
Basic use
The first example simulation demonstrates the visualization with the
default visualizer settings. It can be run by choosing the
OneNetwork configuration from the ini file. The simulation uses the
following network:
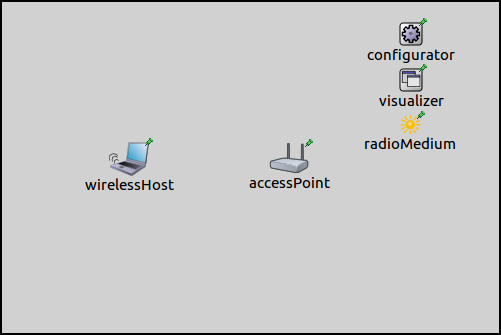
The network contains a WirelessHost and an AccessPoint. The
access point SSID is left at the default setting, "SSID". At the
beginning of the simulation, the host will initiate association with the
access point. When the association process goes through, the node
becomes part of the wireless network, and this should be indicated by
the icon.
The visualization is activated with the visualizer’s
displayAssociations parameter:
*.visualizer.ieee80211Visualizer.displayAssociations = true
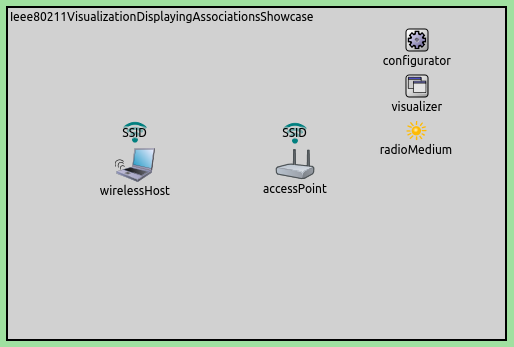
When the simulation is run for a while, the network will look like the following. Note the icons above the host and the access point.
Multiple networks
The following example simulation demonstrates the visualization when
multiple networks are present. The simulation can be run by choosing the
MultipleNetworks configuration from the ini file.
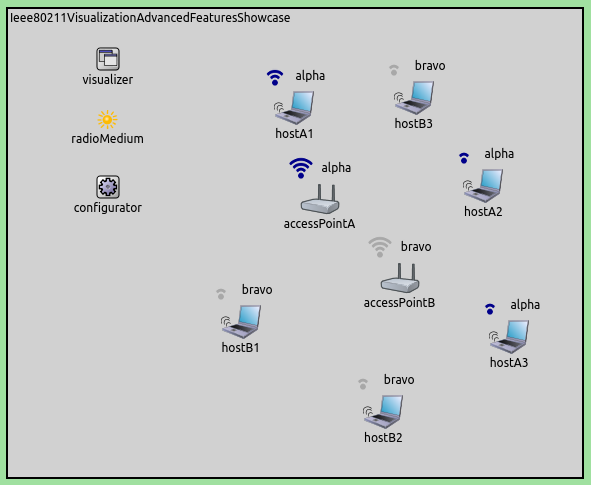
The network contains two AccessPoint’s with different SSIDs, and
three WirelessHost’s configured to associate with each. We will see
the icons being color-coded. When the association processes take place,
the network will look like the following. Note the different SSIDs
(alpha, bravo) and the colors.
Visualizing handover
The following example simulation shows how visualization can help you
follow handovers in the network. The simulation can be run by choosing
the VisualizingHandover configuration from the ini file. The network
contains two AccessPoint’s with different SSIDs, alpha and
bravo. There is also a WirelessHost which is configured to move
horizontally back and forth between the two access points. Transmission
powers are configured so that when a host gets near one access point, it
will go out of the range of the other access point. This transition will trigger a
handover.
The communication ranges of the access points are visualized as blue circles. The following animation shows what happens when the simulation is run. Note how the indicator above the host changes after each handover.
Further information
For more information on IEEE 802.11 visualization, see the Ieee80211Visualizer NED documentation.
Try It Yourself
If you already have INET and OMNeT++ installed, start the IDE by typing
omnetpp, import the INET project into the IDE, then navigate to the
inet/showcases/visualizer/canvas/ieee80211 folder in the Project Explorer. There, you can view
and edit the showcase files, run simulations, and analyze results.
Otherwise, there is an easy way to install INET and OMNeT++ using opp_env, and run the simulation interactively.
Ensure that opp_env is installed on your system, then execute:
$ opp_env run inet-4.6 --init -w inet-workspace --install --build-modes=release --chdir \
   -c 'cd inet-4.6.*/showcases/visualizer/canvas/ieee80211 && inet'
This command creates an inet-workspace directory, installs the appropriate
versions of INET and OMNeT++ within it, and launches the inet command in the
showcase directory for interactive simulation.
Alternatively, for a more hands-on experience, you can first set up the workspace and then open an interactive shell:
$ opp_env install --init -w inet-workspace --build-modes=release inet-4.6
$ cd inet-workspace
$ opp_env shell
Inside the shell, start the IDE by typing omnetpp, import the INET project,
then start exploring.
Discussion
Use this page in the GitHub issue tracker for commenting on this showcase.