Visualizing Network Path Activity
Goals
When simulating networks, it is often useful to have a visual representation of network traffic. INET provides several visualizers for this purpose, each operating at different levels of the network stack. The focus of this showcase is on the NetworkRouteCanvasVisualizer, which graphically displays network layer traffic in the form of polyline arrows along the path that fade as the traffic ceases.
The showcase contains four simulation models, each demonstrating different features of the network path activity visualizer.
4.6About the Visualizer
In INET, network path activity can be visualized by including a
NetworkRouteCanvasVisualizer module in the simulation. Adding an
IntegratedCanvasVisualizer module is also an option because it also
contains a NetworkRouteCanvasVisualizer module. Network path activity
visualization is disabled by default; it can be enabled by setting the
visualizer’s displayRoutes parameter to true.
NetworkRouteCanvasVisualizer currently observes packets that pass through the network layer (i.e. carry data from/to higher layers), but not those that are internal to the operation of the network layer protocol. That is, packets such as ARP, although potentially useful, will not trigger the visualization. Visualizing such packets may be implemented in future INET revisions.
The activity between two nodes is represented visually by a polyline arrow which points from the source node to the destination node. NetworkRouteCanvasVisualizer follows packet throughout its path, so the polyline goes through all nodes that are part of the packet’s path. The arrow appears after the first packet has been received, then gradually fades out unless it is reinforced by further packets. Color, fading time and other graphical properties can be changed with parameters of the visualizer.
By default, all packets and nodes are considered for the visualization.
This selection can be narrowed with the visualizer’s packetFilter
and nodeFilter parameters.
Enabling Visualization of Network Path Activity
The following example shows how to enable the network path activity
visualization with its default settings. For the first example, we
configured a wired network. The simulation can be run by choosing the
EnablingVisualization configuration from the ini file.
The network contains two StandardHost’s, a source host and a
destination host. In this configuration, the source host will be
pinging the destination host.
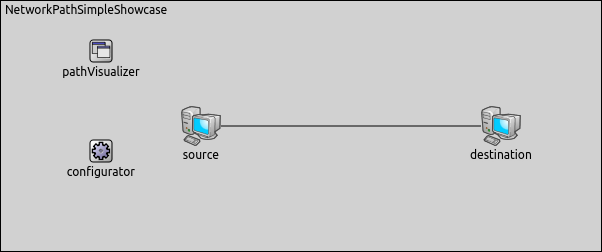
The pathVisualizer's type is NetworkRouteCanvasVisualizer. We enable
network path activity visualization by setting the displayRoutes
parameter to true.
*.pathVisualizer.*.displayRoutes = true
The following video shows what happens when we start the simulation.
At the beginning of the video, a red strip appears and moves from
source to destination. This strip is the standard OMNeT++
animation for packet transmissions and has nothing to do with
NetworkRouteCanvasVisualizer. When the packet is received in whole by
destination (the red strip disappears), an arrow is added by
NetworkRouteCanvasVisualizer between the two hosts, indicating network
path activity. The packet’s name is also displayed on the arrow. The
arrow fades out quickly because the fadeOutTime parameter of the
visualizer is set to a small value.
Note, however, that ARP traffic does not activate the visualization because ARP packets do not pass through the network layer.
Filtering Network Path Activity
In complex networks where many nodes are placed and several protocols are used, it is often useful to be able to filter network traffic to visualize only the part of the network traffic we are interested in.
The following example shows how to set packet filtering. This simulation
can be run by choosing the StaticNetworkPaths configuration from the
ini file.
We use the following network for this showcase:
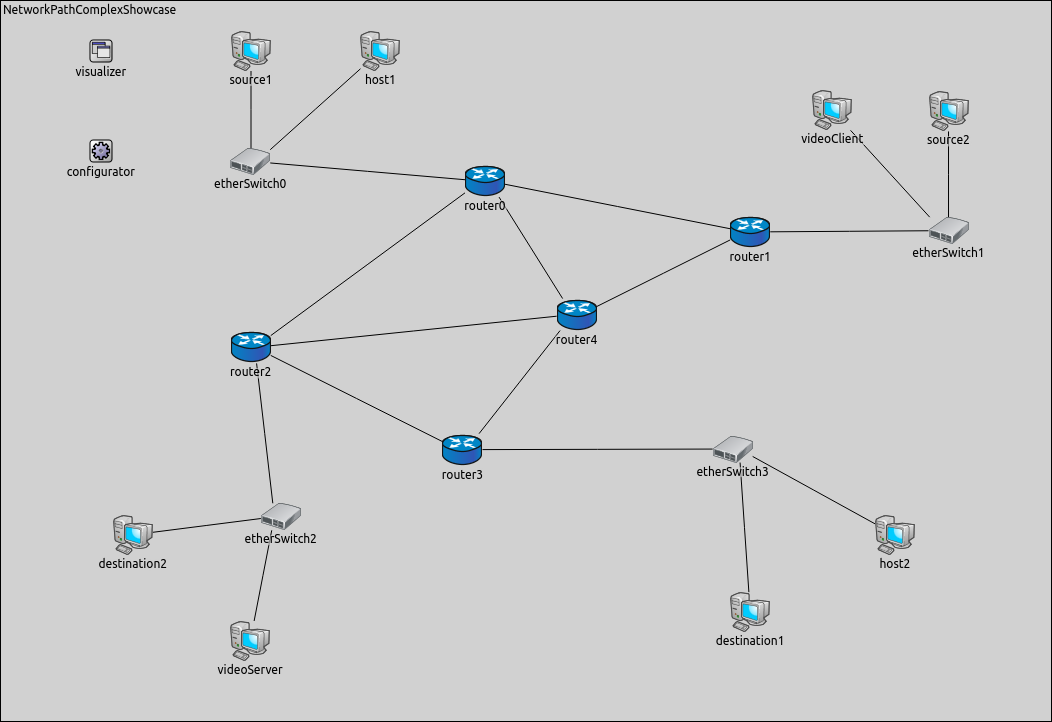
The network consists of five Router modules (router0..router4), four
EthernetSwitch modules (etherSwitch0..etherSwitch3) and eight
StandardHost’s. There are two source hosts, source1 and
source2, which will be pinging the two destination hosts,
destination1 and destination2. The videoServer node streams
a video to the videoClient node. The remaining two endpoints
(host1 and host2) are inactive in this simulation.
For this network, the visualizer’s type is IntegratedCanvasVisualizer.
Network path visualization is filtered to display only ping traffic. The
video stream packets are not visualized by network path activity
visualizer. The fadeOutMode and fadeOutTime parameters have been
adjusted so that the network path activity arrow does not fade out
completely before the next ping packet arrives.
*.visualizer.networkRouteVisualizer.displayRoutes = true
*.visualizer.networkRouteVisualizer.packetFilter = "ping*"
*.visualizer.networkRouteVisualizer.fadeOutMode = "simulationTime"
*.visualizer.networkRouteVisualizer.fadeOutTime = 1.4s
The following video shows what happens when the simulation is run.
Each arrow has a different color indicating different paths. You can see
that although there are both video stream and ping traffic in the
network, NetworkRouteCanvasVisualizer displays only the latter, due to the
presence of the packetFilter parameter.
Visualizing Network Path Activity in a Mobile Ad-Hoc Network
The following example shows how visualization can help you to follow
dynamically changing network path activity in a wireless environment.
The simulation can be run by choosing the Mobile configuration from
the ini file.
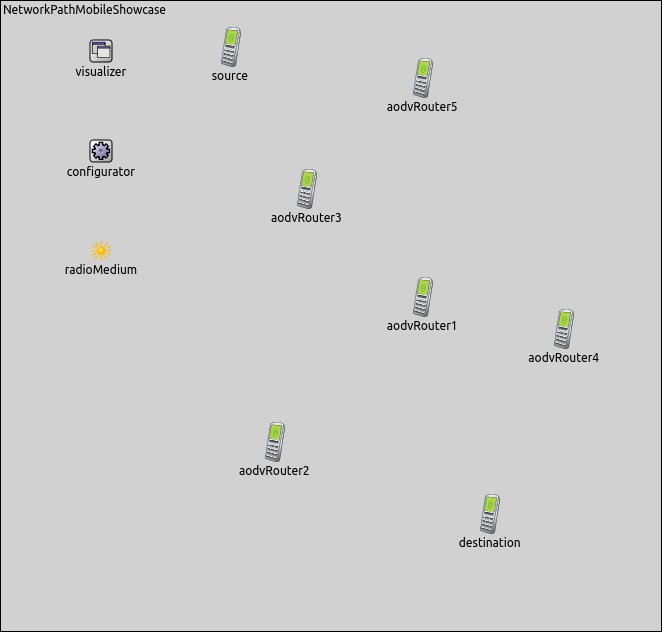
Nodes are of the type AodvRouter, and are placed randomly on the
scene. One of the nodes is the source node which will be
pinging the destination node. The communication ranges of the nodes
have been chosen so that the network is connected, but nodes can
typically only communicate by using multi-hop paths. The nodes will also
randomly roam within predefined borders.
The routing protocol is AODV, a reactive (on-demand) MANET routing
protocol. AODV operates with RREQ and RRES messages, but these messages
do not appear in the visualization because they do not pass through the
network layer. (You can watch a video about the AODV route searching
process in the Data Link Activity showcase, in the
Visualizing Data Link Activity in a Mobile Ad-Hoc Network
configuration.)
We use the following configuration for the visualization.
*.visualizer.networkRouteVisualizer.displayRoutes = true
*.visualizer.networkRouteVisualizer.packetFilter = "ping*"
*.visualizer.networkRouteVisualizer.fadeOutMode = "simulationTime"
*.visualizer.networkRouteVisualizer.fadeOutTime = 5s
The following video shows what happens when the simulation is run.
Blue circles are displays the communication range of source and
destination.
The video shows the network path taken by ping packets between
source and destination. Ping packets are forwarded to the next
hop until they reach destination. The network path activity is
visualized after the ping packet has arrived to destination, so we
get information about path changes immediately.
When the existing route breaks due to two nodes drifting away (going out of the communication range of each other), this manifests as a link-level failure. This condition is detected by AODV, and it starts searching for a new route. When the new route is found, the ping traffic resumes.
You can observe in the video that the route the ping packets take is not always optimal (in terms of hop count). The reason is that nodes use an existing route as long as possible, even when a shorter route becomes available as a result of node movement. AODV is only activated when the existing route breaks.
Displaying Network Path Activity in a Complex Network
This configuration demonstrates how the visualizer reacts to the routing
changes in a complex network. A simulation is created for this example.
The simulation can be run by choosing the ChangingPaths
configuration from the ini file.
The network contains four routers (router0..router3) which are
connected to create redundant network paths. The network also
contains six hosts. There is a wired and a wireless source-destination
pair. The remaining two hosts are inactive in this simulation. The wired
hosts are connected to the routers via switches (etherSwitch0 and
etherSwitch1), the wireless hosts are connected to the routers via
access points (accessPoint0 and accessPoint1).
The following image displays the network for this example.

IP addresses are assigned manually, using the configuration file
configuration.xml. A lifecycle control script (changeRoute.xml)
has also been created for this configuration to turn the routers off and
on at certain times. The network uses the RIP routing protocol to ensure
that routing tables will be dynamically updated as a reaction to network
topology changes. During the simulation, wiredSource will be pinging
wiredDestination, and wirelessSource will be pinging
wirelessDestination.
In this showcase, we set the packetFilter parameter to display only
ICMP echo traffic. We use the following configuration for the
visualization.
*.visualizer.networkRouteVisualizer.displayRoutes = true
*.visualizer.networkRouteVisualizer.packetFilter = "ping* and not *reply"
*.visualizer.networkRouteVisualizer.fadeOutMode = "simulationTime"
*.visualizer.networkRouteVisualizer.fadeOutTime = 1.4s
In the following video we can examine that how network path activity visualization follows the routing changes in a complex network.
At the beginning of the video, ping traffic is routed through
router1. After five seconds, small cogwheels appear above
router1, then cogwheels change to a red cross, indicating that
router1 has gone offline. Routers immediately update their routing
tables by using the RIP routing protocol. In the next few seconds, the
traffic between the sources and the destinations travels via
router3.
After a while, router1 turns on again (the red cross disappears),
but this does not affect the ping traffic which still goes via
router3. In the 15th second, we can see that router3 goes
offline. Routing tables are updated by using RIP, and as a result of
this, ping traffic flows through router1 again. At the end of the
video, router3 turns on, but it does not have an effect on the
network traffic.
Sources: omnetpp.ini, NetworkPathVisualizerShowcase.ned, configuration.xml, changeRoute.xml
More Information
This example only demonstrated the key features of network path visualization. For more information, refer to the NetworkRouteCanvasVisualizer NED documentation.
Try It Yourself
If you already have INET and OMNeT++ installed, start the IDE by typing
omnetpp, import the INET project into the IDE, then navigate to the
inet/showcases/visualizer/canvas/networkpathactivity folder in the Project Explorer. There, you can view
and edit the showcase files, run simulations, and analyze results.
Otherwise, there is an easy way to install INET and OMNeT++ using opp_env, and run the simulation interactively.
Ensure that opp_env is installed on your system, then execute:
$ opp_env run inet-4.6 --init -w inet-workspace --install --build-modes=release --chdir \
   -c 'cd inet-4.6.*/showcases/visualizer/canvas/networkpathactivity && inet'
This command creates an inet-workspace directory, installs the appropriate
versions of INET and OMNeT++ within it, and launches the inet command in the
showcase directory for interactive simulation.
Alternatively, for a more hands-on experience, you can first set up the workspace and then open an interactive shell:
$ opp_env install --init -w inet-workspace --build-modes=release inet-4.6
$ cd inet-workspace
$ opp_env shell
Inside the shell, start the IDE by typing omnetpp, import the INET project,
then start exploring.
Discussion
Use this page in the GitHub issue tracker for commenting on this showcase.