Visualizing Network Nodes
Goals
INET offers several options for visualizing network nodes in 2D (canvas) and 3D (OSG) views. This provides a visually appealing representation of the network, and customizing the appearance can also aid in highlighting important nodes or differentiating them based on location or function. Options include specifying icons, 3D models, and colorization.
This showcase demonstrates the visualization options for network nodes in simulations and how to customize their appearance.
Note
This showcase requires OMNeT++ built with OSG enabled.
4.6About the Visualizer
In INET simulations, NetworkNodeVisualizer module (included in the
network as part of IntegratedVisualizer) is responsible for
visualizing network nodes. NetworkNodeVisualizer includes two
submodules: NetworkNodeCanvasVisualizer, which is responsible for
visualizing nodes on the 2D canvas, and NetworkNodeOsgVisualizer,
which visualizes nodes in 3D scenes.
Both visualizer modules operate on all network nodes by default, but you can narrow
the list of nodes to be displayed by using the nodeFilter parameter.
Visualization on the 2D canvas
On the 2D canvas, each node is represented by an icon, which can be displayed in various sizes and can also be colorized.
The icon of the node can be customized by setting the display string of the
node in the network description (NED). Display strings, which appear
as @display properties in NED, are explained in the
OMNeT++ Simulation Manual.
Display strings consist of tags, and i defines the icon. It has three arguments.
The first one selects the icon itself. The second and third define colorization:
a color (color name or HTML-style RGB) and a colorization percentage.
Icon size is denoted by an abbreviation (vs for very small, s for small,
n for normal, l for large and vl for very large) and can be
specified either as a suffix on the icon name (node/router_vl), or
with the is display string tag.
The above display string based visualization, being an OMNeT++ mechanism,
does not require NetworkNodeCanvasVisualizer to be present. However,
NetworkNodeCanvasVisualizer is required for several other visualizers
(e.g. those that display annotations around the node icon) to work.
In addition, NetworkNodeCanvasVisualizer lets you use an arbitrary image
(not just an icon) for a node, by setting the node’s canvasImage and
canvasImageColor parameters.
Visualization on a 3D scene
NetworkNodeOsgVisualizer is responsible for displaying nodes on a 3D
scene. (Note that IntegratedVisualizer’s osgVisualizer submodule
type must be set to "IntegratedOsgVisualizer" to visualize nodes in 3D.)
OMNeT++’s 3D visualization is based on the open-source OpenSceneGraph (OSG) and osgEarth
libraries. These libraries offer high-level functionality, such as the
ability of using 3D model files directly, accessing and rendering online
map and satellite imagery data sources, and so on. In this showcase, we
deal only with 3D models (and not with maps – displaying maps is
covered in other showcases).
By default, each node is represented in the 3D scene with the same
icon used in the 2D canvas. If you want to replace the 2D icon, you need
to reference an external resource, for example an image or a
3D model file. The resource should be specified in the node’s osgModel
parameter. By default, the OMNeT++ image path is used to find the
image. OSG supports several 3D model (3dc, 3ds, flt, geo, iv, ive,
lwo, md2, obj, osg, osgb, etc.) and image file formats (bmp, gif,
jpg, png, rgb, tga, tif, etc.)
There is support for so-called “pseudo loaders” in OSG, which provide additional options for loading 3D models. Pseudo loaders perform basic transformations on the 3D model after it is loaded. To use pseudo loaders, append modifiers to the end of the file name:
The
scalemodifier multiplies the size of the model by a certain factor. The format isf.scale, wherefis the numeric factor. If a decimal fraction is used, it must be enclosed in parentheses, as in(0.8).scale.The
transmodifier translates the model along the X, Y and Z axes by the given values. The format isX,Y,Z.trans.The
rotmodifier rotates the model around the X, Y and Z axes. The format of therotpseudo loader isX,Y,Z.rot, with the values given in degrees.
The modifiers should be separated by dots. Consider the following example:
*.exampleNode.osgModel = "example.osg.2.scale.0,0,10.trans.180,0,90.rot"
example.osgis the file name of the external 3D model that represents theexampleNodenetwork node,2.scalescalesexample.osgto 200%,0,0,10.transtranslatesexample.osg10 units upwards,180,0,90.rotrotatesexample.osg180 degrees around the X axis and 90 degrees around the Z axis,
The color of the model also can be changed by using the
osgModelColor parameter. This parameter accepts English color names
(more precisely, SVG color names) and HTML-style RGB values.
Displaying the node name is also optional: it is displayed by default
but can be hidden by setting the visualizer’s displayModuleName
parameter to false.
Examples
The following examples use the same network. The network contains two
network nodes, pedestrian and car. Both of them are of the
type AdhocHost, which has a cellphone icon by default.
Canvas (2D view)
In this example, the node icons have been changed from the default
by modifying the corresponding submodule display strings
in the NED definition of the network.
The p display string tag defines the position of the nodes.
On the 2D canvas, the (0,0) position is in the upper left corner of the
playground.
        car: AdhocHost {
            @display("p=168,117;i=misc/car2");
        }
        pedestrian: AdhocHost {
            @display("p=113,156;i=misc/person");
        }
The simulation can be “run” (it does nothing) by selecting the Canvas
configuration from omnetpp.ini. You should see the following:
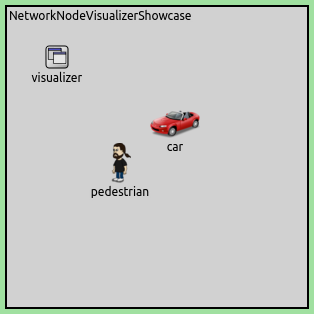
The canvas displays a man and a car icon that represent the nodes.
Default 3D view
The OSG-based 3D view can be enabled by adding any visualizer module that uses it. In our case, we add a NetworkNodeOsgVisualizer by enabling it in IntegratedVisualizer.
*.visualizer.osgVisualizer.typename = "IntegratedOsgVisualizer"
When you run the Basic3D configuration on the ini file, you should
see something like the following:
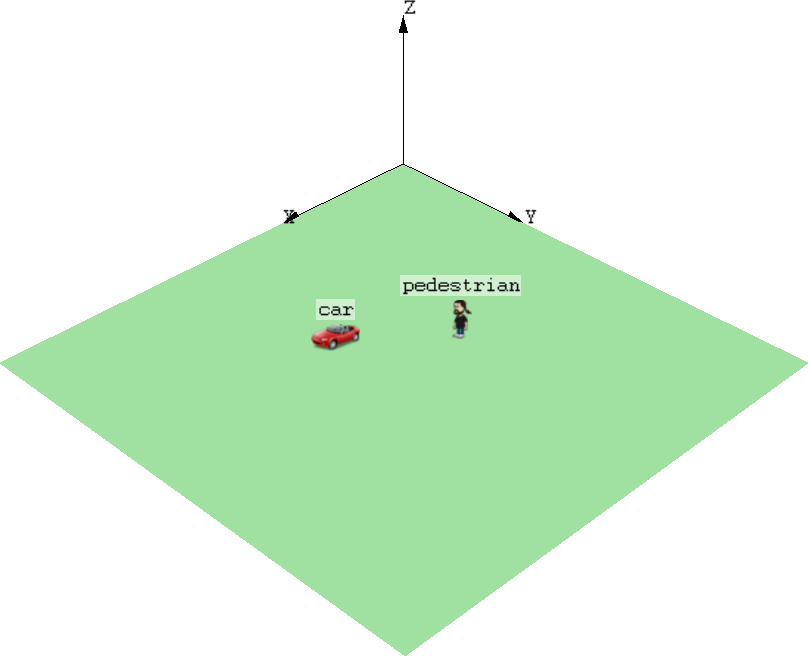
By default, nodes are displayed on the 3D scene using the same icons as on the 2D canvas. The playground axes are also displayed in the above screenshot (for brevity, the corresponding configuration lines have been omitted from the ini file).
Using 3D models
In our next experiment, we replace the icon of the nodes with external
3D models, boxman.osgb and the car.osgb. The models will be scaled
in order to be proportionate to each other.
*.car.osgModel = "car.osgb.100.scale"
*.pedestrian.osgModel = "boxman.osgb.(0.3).scale"
You can run the simulation by selecting the Using3DModels configuration
from the ini file. The following animation shows how the nodes look
like after we have replaced their icons with 3D models.
The pedestrian node is represented by an animated walking boxman, and
the car node is represented by a car model.
Adjusting orientation
The orientation of network nodes is updated by their own mobility
submodules. It is possible that the orientation of the 3D model does not
match the orientation of the node. For example, when we add motion
to our previous configuration (select AddingMovement from the ini file),
the boxman will walk sideways:
The orientation of the 3D model can be initialized by the rot pseudo
loader. If the node is a mobile node then the mobility submodule of the
node will manage future rotations of the node during the simulation. To
achieve the correct orientation, the pedestrian 3D model should be
rotated 90 degrees counterclockwise around the Z axis.
*.pedestrian.osgModel = "boxman.osgb.(0.3).scale.0,0,90.rot" # Rotating to the appropriate orientation
The above animation shows that both 3D models’ orientation is correct. They are initialized by pseudo loaders and updated by the mobility model of the network node.
Sources: omnetpp.ini, NetworkNodeVisualizerShowcase.ned
More Information
This example only demonstrates the key features of network node visualization. For more information, refer to the NED documentation of NetworkNodeVisualizer, NetworkNodeCanvasVisualizer, and NetworkNodeOsgVisualizer.
Try It Yourself
First, install INET and OMNeT++. Then, start the IDE by typing
omnetpp, import the INET project into the IDE, then navigate to the
inet/showcases/visualizer/osg/networknode folder in the Project Explorer. There, you can view
and edit the showcase files, run simulations, and analyze results.
Currently, opp_env-based installation is not available for the 3D visualization (OSG-based) showcases.
Discussion
Use this page in the GitHub issue tracker for commenting on this showcase.